EUR/CAD Symmetrical Triangle Ready to Break Out?
EURCAD has been consolidating within a symmetrical triangle since the start of the month, with lower highs and higher lows converging toward the apex near the 1.6060 area.

EURCAD has been consolidating within a symmetrical triangle since the start of the month, with lower highs and higher lows converging toward the apex near the 1.6060 area.

WTI crude oil has been on a steady climb since the start of the month, with the rising lows connected by an ascending trend line that has held firm throughout the rally.

Natural gas broke down from its longer-term ascending trend line that had connected the higher lows since mid-August, confirming a shift in short-term momentum after price stalled just under the $3.013 swing high.
GBPCHF has been carving out a symmetrical triangle pattern since mid-August, with lower highs and higher lows converging toward a tighter and tighter consolidation range.
WTI crude oil has broken out of its symmetrical triangle formation, with price surging past the triangle top to reach highs around $97.79 per barrel.
Natural gas is testing a key area of interest around $2.788, a support zone that also lines up with the pair’s month-long consolidation floor.
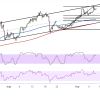
CADCHF has been grinding higher within a well-defined ascending channel that’s been intact for over a month, with price recently tagging the channel top near the 0.5884 area before stalling.
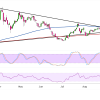
WTI crude oil appears to be breaking out of a lengthy symmetrical triangle pattern that has been forming since the March highs, with price recently pushing above the upper trend line near $90.00 to test the $94.44 area.