
On Friday, the Bitcoin price bounced back from the current 3-month low of about $67,564 to trade at about $68,993. BTC/USD trades within a descending channel formation on the 60-minute chart.
The price of the pioneer cryptocurrency continues to trade several levels below the 100-hour moving average line, despite the rebound. Friday’s rebound helped Bitcoin recover from the oversold levels of the 14-hour RSI.
Bitcoin Price Fundamentals Overview

From a fundamental perspective, BTC/USD trades during a relatively busy period in the US market. On Thursday, US initial jobless claims for last week came in worse than expected, at 200k versus a forecast of 195k, up from 191k the prior week. On the other hand, the continuing claims for the preceding 4 weeks fell to 1.697 million (MoM), down from 1.717 million, and below the forecast claim count of 1.72 million.
Elsewhere, US existing home sales for October fell to 3.75 million, down from 3.97 million, missing the forecast of 3.85 million. Existing home sales changed -5.5% for the period, down from 1% (MoM) the previous month. The US monthly budget statement for October also fell short of the forecast figure of $-298.6 billion, at $-404.1 billion, down from the previous month’s equivalent of $27 billion.
Earlier in the week, the US consumer price index for October came in hotter than expected, at 0.4% (MoM) versus a forecast of 0.3%, down from the previous month’s equivalent of 0.6%. On the other hand, the consumer price index ex-food and energy for the period remained steady at 0.3%, above the forecast rate of 0.2%. Elsewhere, the Redbook Index edged slightly lower to 10.1% (YoY), down from 10.3%, but above the forecast rate of 9.3%.
Bitcoin Price Technical Analysis (the 60-min Chart)
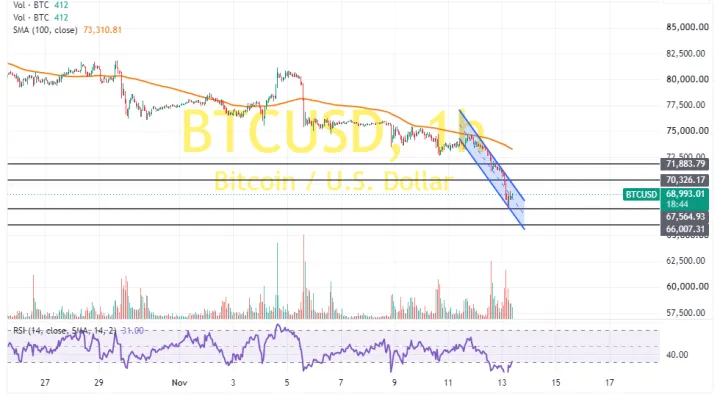
Technically, the Bitcoin price trades within a descending channel formation on the 60-minute chart. However, the 14-hour RSI has recently bounced back in an attempt to recover from oversold conditions.
Therefore, the bulls will look to stretch the current rebound towards $70,326 or higher, up to $71,883. On the other hand, the bears will look to ride the current run of declines toward $67,564 or lower, down to $66,007.
Bitcoin Price Technical Analysis (the Daily Chart)

In the daily chart, the price of the pioneer cryptocurrency has recently completed a downward breakout from a descending channel formation. The 14-day RSI also supports a long-term bearish bias after entering oversold conditions.
Therefore, the bears will look to ride the current run of declines toward $64,225 or lower, down to $59,122. On the other hand, the bulls will look to pounce on rebounds at about $73,795 or higher, up to $78,580.