
On Thursday, the Bitcoin price bounced back from the session lows of about $80,193 to trade at about $81,786. BTC/USD trades within a descending channel formation on the 60-minute chart.
The price of the pioneer cryptocurrency has now plummeted to trade several levels below the 100-hour moving average line. However, Thursday’s late rebound helped Bitcoin recover from the oversold levels of the 14-hour RSI.
Bitcoin Price Fundamentals Overview

From a fundamental perspective, BTC/USD trades during a relatively busy period in the US market. On Friday, Trump announced that the U.S. will not attack Iran before the midterms are done. This alleviated fears that oil prices could rise again due to US-Iran tensions, which lowers energy-related risks on risk assets like Bitcoin.
In the latest US economic data, the initial jobless claims for last week came in better than expected, at 197k versus the forecast of 200k, down from the previous week’s revised equivalent of 199k. The continuing claims for the preceding four weeks rose to 1.716 million, up from 1.699 million, missing the forecast claim count of 1.71 million. On the other hand, wholesale inventories for August outperformed the expected change of 0.7%, with a change of 0.5%.
Earlier in the week, the US ISM Services PMI for September missed the forecast reading of 55, with a reading of 54.9, down from the previous month’s equivalent of 55.4. The ISM Services New Orders Index for the period also fell to 59.8, down from 60.9 in August. On the other hand, the ISM Services Employment Index rose to 50.1, up from 47.8, while the ISM Services Prices Paid improved to 74, up from 72.6.
Bitcoin Price Technical Analysis (the 60-min Chart)
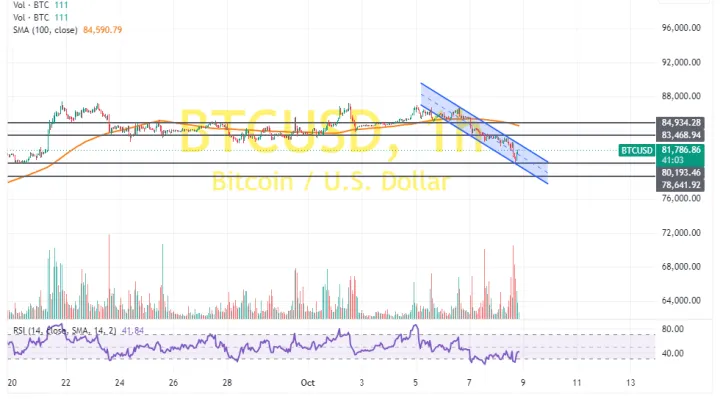
Technically, the Bitcoin price trades within a descending channel formation on the 60-minute chart. However, the 14-hour RSI has recently bounced back to recover from oversold conditions.
Therefore, the bulls will look to extend the current rebound towards $83,468 or higher, up to $84,934. On the other hand, the bears will look to stretch the current declines toward $80,193 or lower, down to $78,641.
Bitcoin Price Technical Analysis (the Daily Chart)
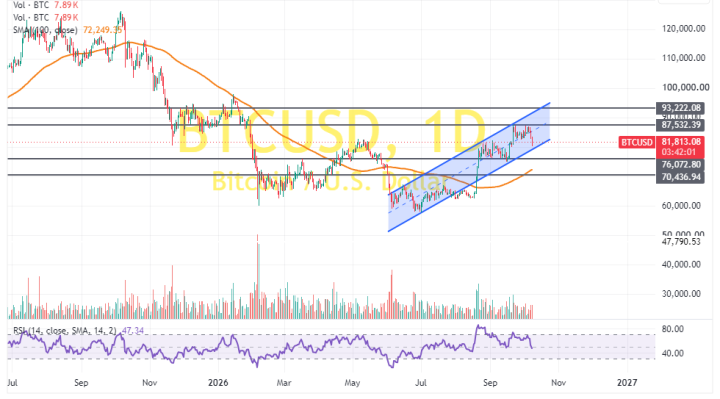
In the daily chart, the price of the pioneer cryptocurrency trades within an ascending channel formation. However, the 14-day RSI has recently pulled back to avoid rallying into overbought conditions.
Therefore, the bears will look to extend the current pullback towards $76,072 or lower, down to $70,476. On the other hand, the bulls will look to pounce on rebounds at about $87,532 or higher, up to $93,222.