
Bitcoin (BTC) is testing key price levels as technical chart highlights a potential bullish reversal pattern. Aksel Kibar, a Chartered Market Technician working for Tech Charts, recently outlined several classical chart patterns across major crypto pairs. His charts identify important support and resistance levels that could influence near-term direction of BTC and ETH.
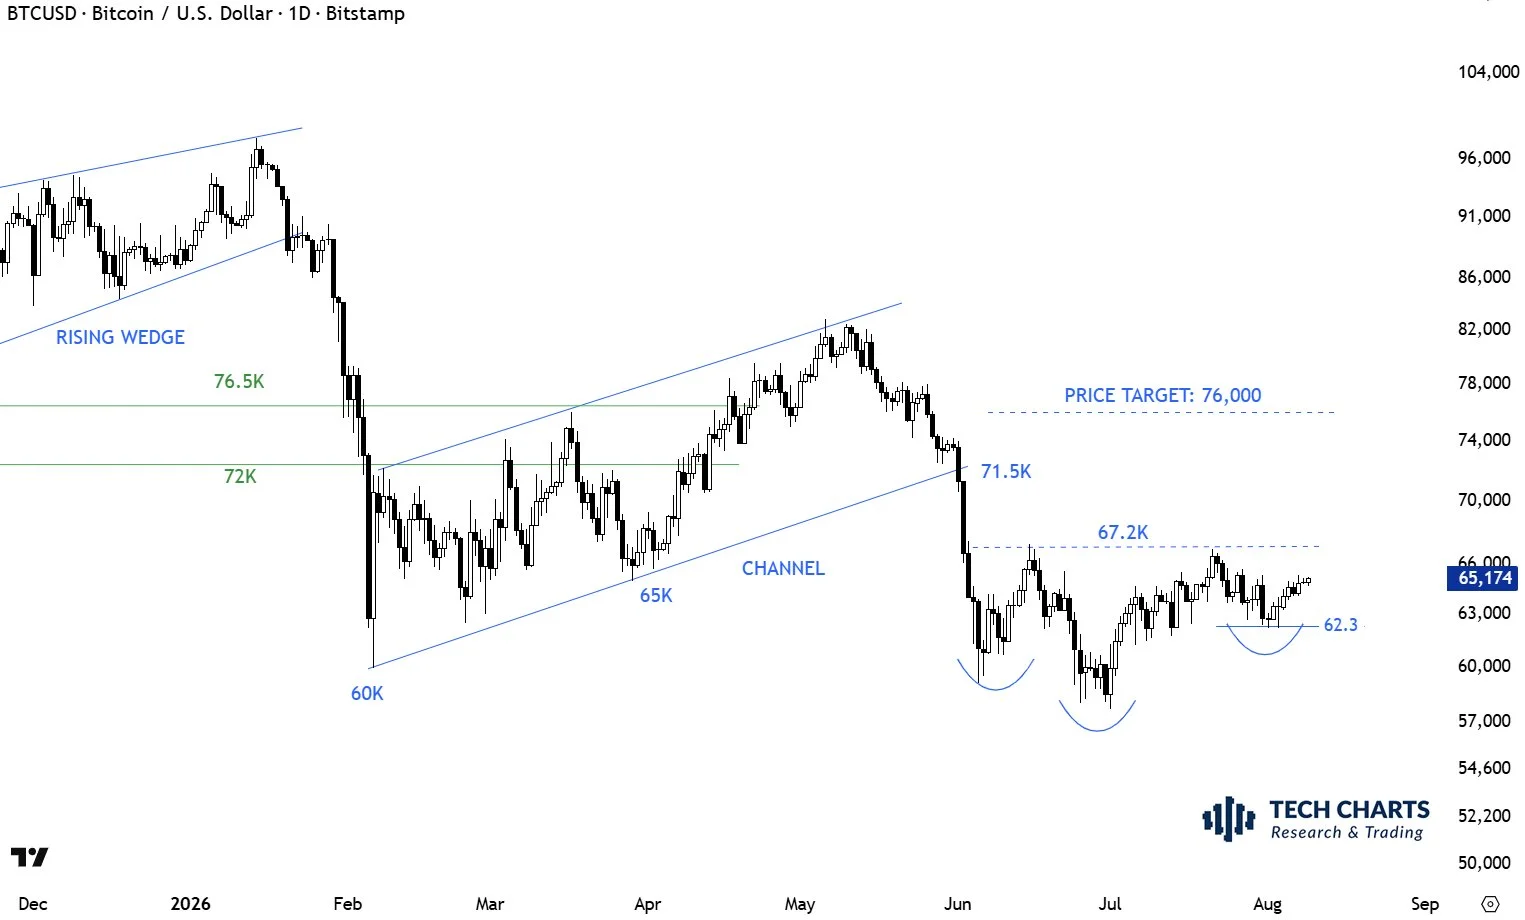
On Bitcoin, Kibar has identified a head-and-shoulders (H&S) bottom pattern with a horizontal neckline near $67,200. The right shoulder of the formation has a low around $62,300. Bitcoin is currently trading around $65,174.
Bitcoin Head-and-Shoulders Pattern Confirmation Levels

The Bitcoin chart presents two important levels that could determine whether the potential reversal pattern succeeds or fails. A move above the $67,200 neckline could confirm the bullish formation. On the other hand, a drop below $62,300 right-shoulder low could invalidate the whole setup. If Bitcoin successfully breaks above the neckline, the pattern points toward a measured price target of approximately $76,000.
Ethereum-Bitcoin Ratio Maintains Bullish Structure
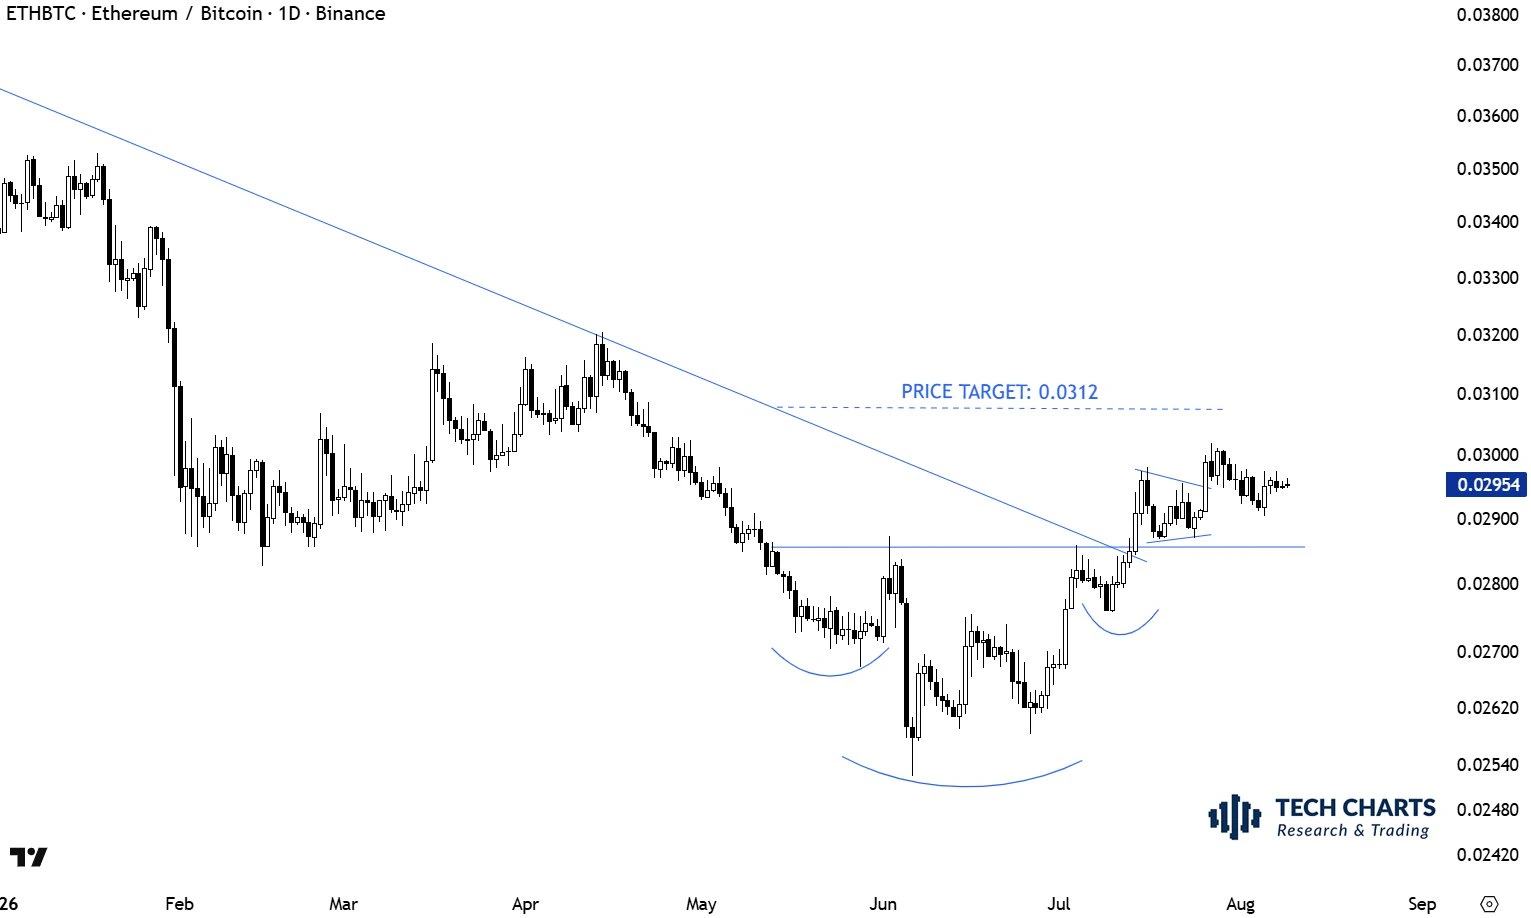
Ethereum/Bitcoin (ETHBTC) pair continues to form higher highs and higher lows. This indicates that its broader technical structure remains intact. The head-and-shoulders bottom target for ETHBTC remains around 0.0312. A continuation of the higher-high and higher-low structure could therefore keep the previously identified target in focus.
Ethereum Retests Key Support Near $1,842
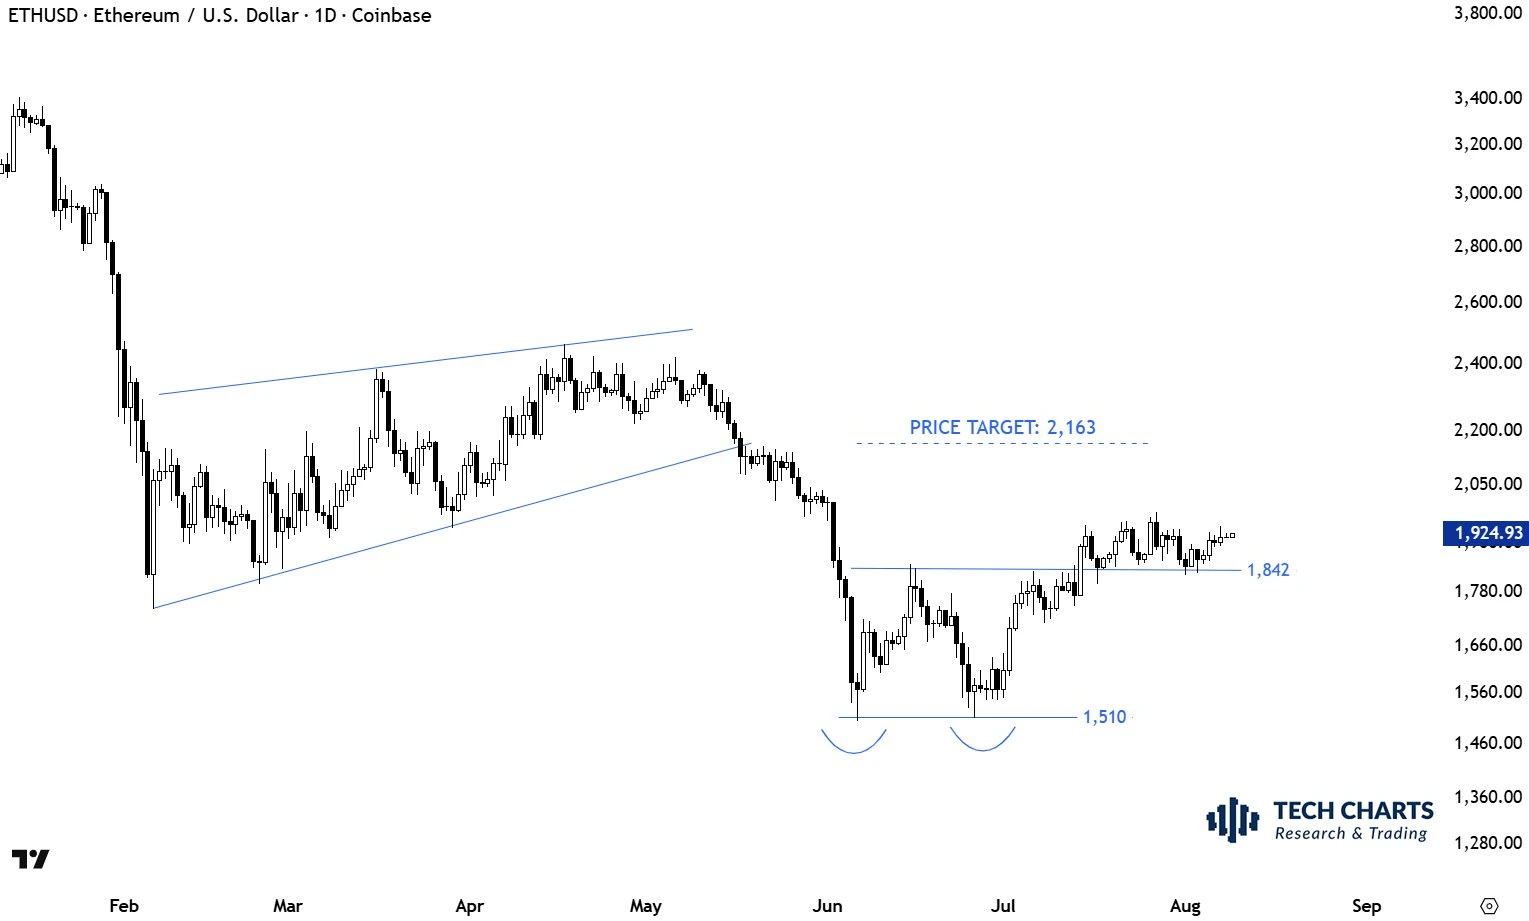
Ethereum (ETH) is testing an important technical level. ETH has held a horizontal boundary near $1,842, with recent price action representing a retest of this key support area. Holding this level could allow Ethereum to resume its upward move. The setup follows an earlier short-term bottom reversal that produced a price target of approximately $2,163.
Kibar’s observations highlight how traders are watching key price levels across Bitcoin and Ethereum for signs of continuation or reversal. While the identified chart patterns could provide potential bullish scenarios, technical formations are not guarantees of future price movements. Bitcoin and other cryptocurrencies would still need to confirm the respective setups through price action around their key support and resistance levels. This article is just reporting and not a financial advice.