
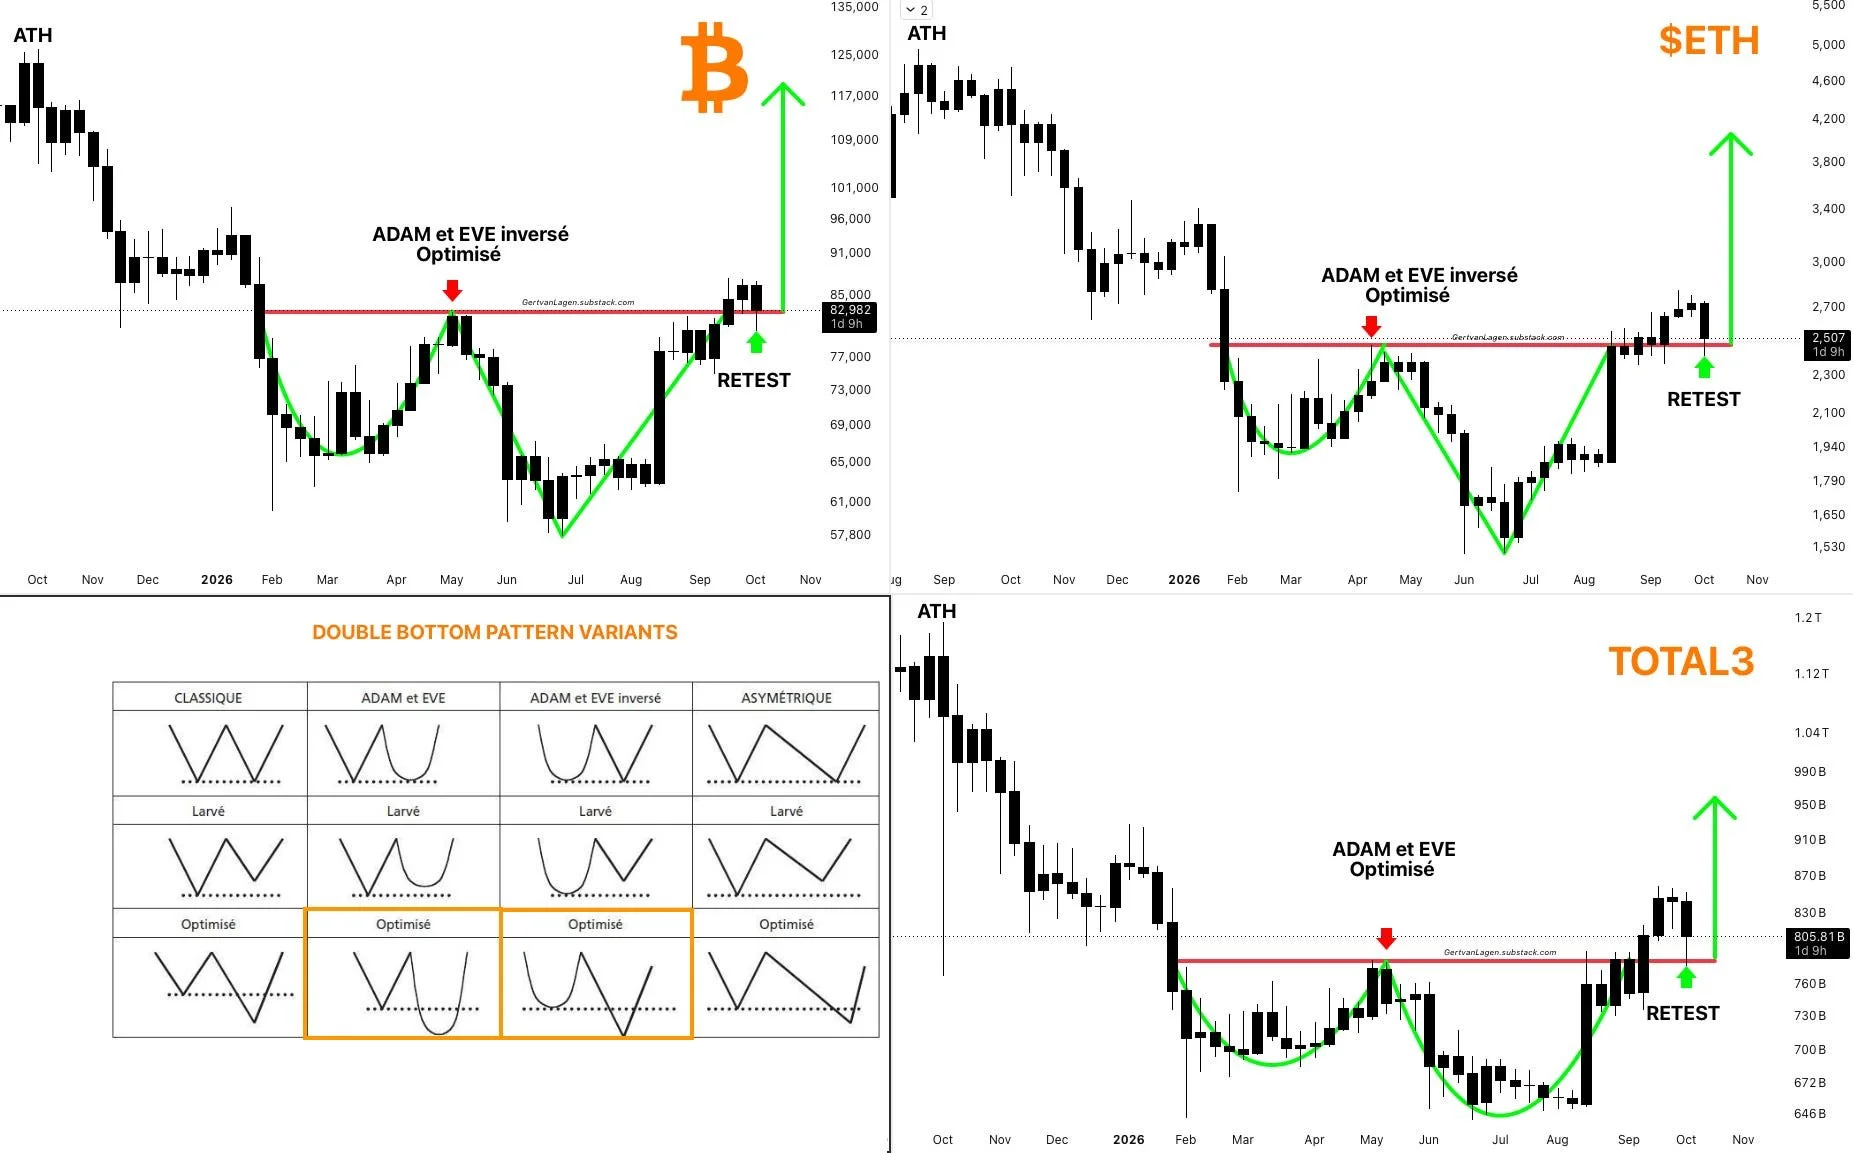
Technical analysis has identified bullish double bottom patterns across Bitcoin (BTC), Ethereum (ETH), and the broader altcoin market, known as TOTAL3. All three charts show successful retests of their respective necklines after breaking above resistance levels. The double bottom patterns have been validated and the resistance levels have now become support. The technical setup indicates improving market strength and a potential reversal from a bearish trend.
BTC Holds Double Bottom Neckline Near $83K
Bitcoin’s chart shows an optimized inverted Adam and Eve double bottom pattern. Two troughs are seen forming a potential reversal structure. The neckline sits around the $82,000–$85,000 region, where BTC previously faced resistance. Bitcoin has broken above the neckline and subsequently returned to test the level. Bitcoin is trading between $82,500–$83,000 today.

ETH Retests Key Resistance Near $2,500
Ethereum is displaying a similar double bottom formation. The neckline is located around $2,500. The chart indicates that ETH moved above this level and then retested it. ETH is trading in $2,485–$2,510 area. Holding above the neckline will likely strengthen recovery. A rejection on the other hand will indicate that buyers have not established firm control.
TOTAL3 Chart Signals Potential Altcoin Strength
The TOTAL3 chart tracks the combined market capitalization of cryptocurrencies excluding Bitcoin and Ethereum. Traders often use it to assess the performance of the wider altcoin market. This chart is also showing a double bottom formation. TOTAL3 recorded a breakout and a retest of the neckline around $800 billion–$830 billion.
The chart suggests that this zone is an important level for determining whether the broader altcoin market can maintain its recovery. If TOTAL3 continues to hold above the neckline, it will indicate improving strength across altcoins.
Double Bottom Patterns Do Not Guarantee Further Gains
A double bottom is a technical chart pattern that forms when an asset tests a similar low twice before breaking above resistance. The appearance of similar patterns across BTC, ETH, and TOTAL3 offers a broader bullish signal. However, the pattern does not guarantee that prices will continue rising.