
On Wednesday, the EUR/USD currency pair pulled back from the session highs of about 1.1653 to trade at about 1.1630. The currency pair trades within an ascending channel formation on the 60-minute chart.
The pair continues to trade slightly above the 100-hour moving average line, despite the latest pullback. As a result, the currency pair still has room left to run before reaching the oversold levels of the 14-hour RSI.
EUR/USD Fundamentals Overview

From a fundamental perspective, the EUR/USD currency pair trades during a relatively busy period in both markets. In the EU, the employment change for Q2 matched the forecast (QoQ) change of 0.1%. On the other hand, the seasonally adjusted gross domestic product for the quarter outshone the estimated change of 0.4%, with a change of 0.6%. The (YoY) equivalent also exceeded the forecast of 1%, with a change of 1.2%.
Elsewhere, Germany’s seasonally adjusted industrial production for July missed the expected (MoM) change of 0.3%, with a change of 1.1%. The country’s seasonally adjusted trade balance for the month improved to EUR 21.3 billion, up from EUR 15.6 billion, beating the forecast of EUR 16 billion.
Traders will be waiting for the ECB’s interest rate decision on Thursday alongside data for Germany’s harmonized index of consumer prices for August.
In the US, traders will be waiting for the initial jobless claims data for last week and the producer price index data for August on Thursday, ahead of the US consumer price index data for the month on Friday.
EUR/USD Technical Analysis (the 60-min Chart)
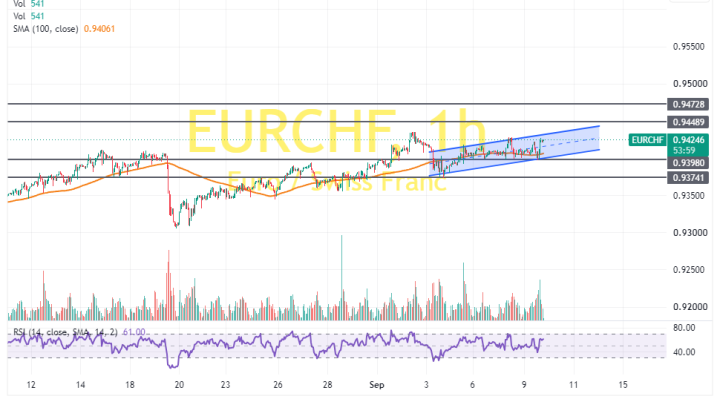
Technically, the EUR/USD currency pair trades within an ascending channel formation on the 60-minute chart. However, the 14-hour RSI has recently pulled back to avoid rallying into overbought conditions.
Therefore, the bears will look to stretch the current pullback towards 1.1607 or lower, to 1.1584. On the other hand, the bulls will look to pounce on profits at about 1.1653 or higher, at 1.1676.
EUR/USD Technical Analysis (the Daily Chart)
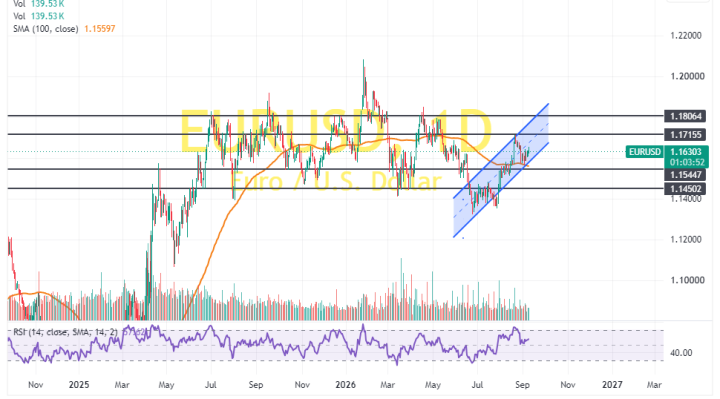
In the daily chart, the EUR/USD currency pair also trades within an ascending channel formation. However, the 14-day RSI has recently pulled back to recover from overbought conditions.
Therefore, the bears will look to pounce on extended pullbacks at about 1.1544 or lower, at 1.1450. On the other hand, the bulls will look to pounce on profits at about 1.1715 or higher, at 1.1806.