
Natural gas has been climbing within a well-defined ascending channel, with price recently tagging the channel top near the $3.015 mark before stalling.
This test of resistance comes after a sharp rally off the mid-channel area, and the reversal candles printed at the ceiling suggest that buyers may need to pause and gather more strength before attempting another push higher.

The Fibonacci retracement tool highlights where dip-buyers could step back in. The 38.2% level sits at $2.948, while the 50% mark is at $2.927. A deeper pullback could reach the 61.8% Fib at $2.906, which lines up closely with the 100 SMA and could serve as a stronger inflection point for bulls to defend.
If the Fib levels hold as support, natural gas could resume its climb toward the channel top or fresh highs; a break below the channel’s rising trend line, however, would raise the risk of a more significant trend reversal.
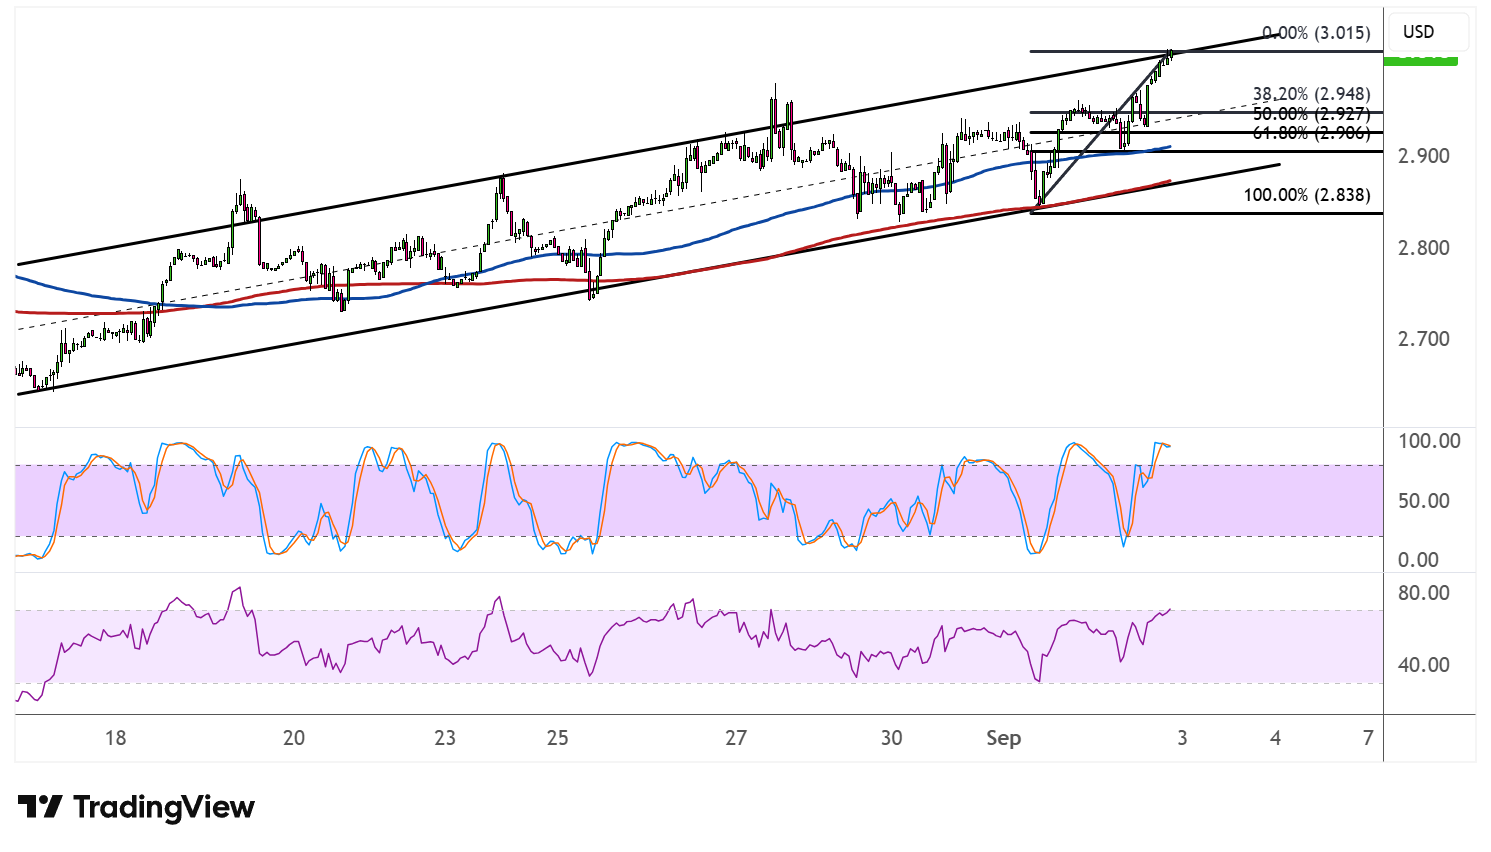
Both moving averages remain aligned to the upside, with the 100 SMA holding above the 200 SMA, confirming that the broader path of least resistance is still higher. Price is also trading above both averages, so these could act as dynamic support if the pullback extends toward the channel’s midpoint or the 100% Fib near $2.838, close to the channel bottom.
Stochastic is turning down sharply from the overbought region, reflecting fading bullish momentum and hinting that a deeper correction could be underway before buyers regroup. The oscillator still has plenty of room to fall before reaching oversold territory, meaning the pullback could persist for a while longer.
RSI, meanwhile, is elevated but has room to decline before hitting oversold conditions, so price could continue drifting lower in the near term while the indicator unwinds.
Natural gas could take cues from inventory data and weather forecasts, as rising temperatures spur demand for cooling commodities. The upcoming NFP release could also strongly impact USD direction and broader sentiment.