
Silver long-term technical analysis
Mirroring gold movement on September, silver rallied at the start of the month. The price encountered resistance at $20 and corrected near $18.50 before making sharp rally after the Fed announce no change in interest rate.
Overall the price moved between $18.50 – $20.00 in September and closed the month at $19.12. Fundamentally silver price affected by news related to the Fed interest rate decision. This year topic has always been about what the Fed will do, but there is one major banking trouble grew slowly in Deutsche Bank. The market jittery on the scale of risk attributed to the bank, is it similar to Lehman Brothers? Fannie Mae, Freddie Mac? Subprime mortgage crisis?

Gold, silver, and precious metals would benefit the most if a disaster happened (Hopefully no disaster happening). We will observe how Deutsche Bank cases unfolded and also watch possibility the Fed cancel rate hike this year.
Click here to see previous month Silver long-term technical analysis September 2016
Monthly chart

Silver successfully maintained its bullish movement above $18.50 for the third month. The price showed contraction similar to the gold price, and range should contract more before a breakout. For month October, range predicted to span between $18.50 – $20.00.
Weekly chart
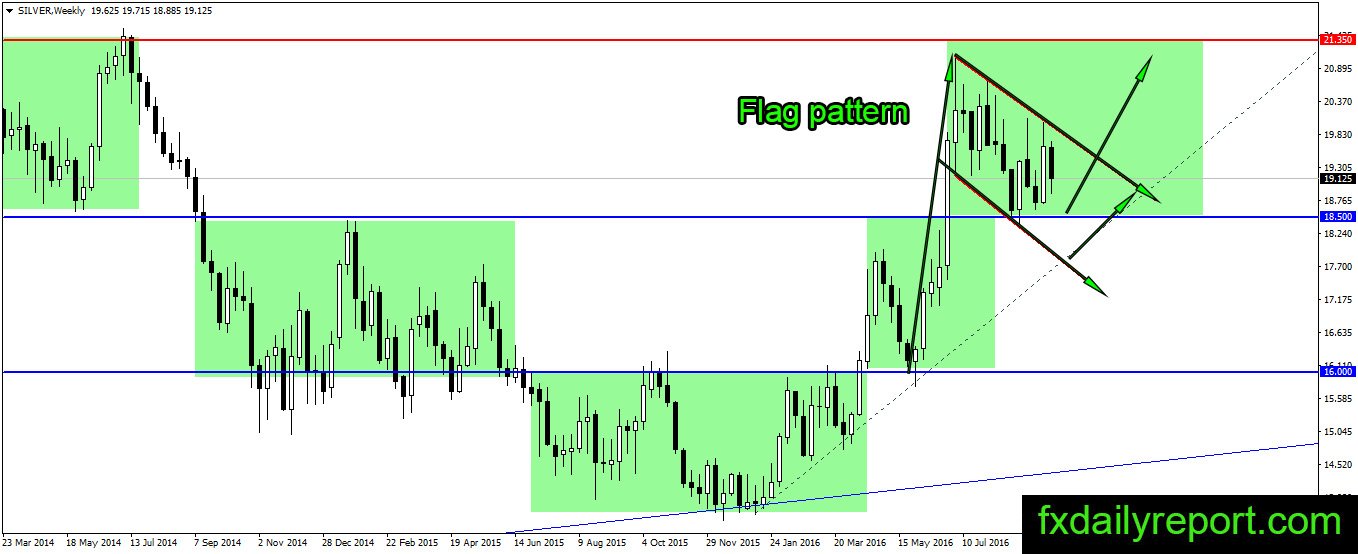
Weekly chart produced interesting pattern to note, a bullish flag pattern. If the price can close above the resistance trendline, we will see $20.00 tested shortly. On the downside, $18.25 – $18.50 is the place to look for the high odds long position.
Daily chart
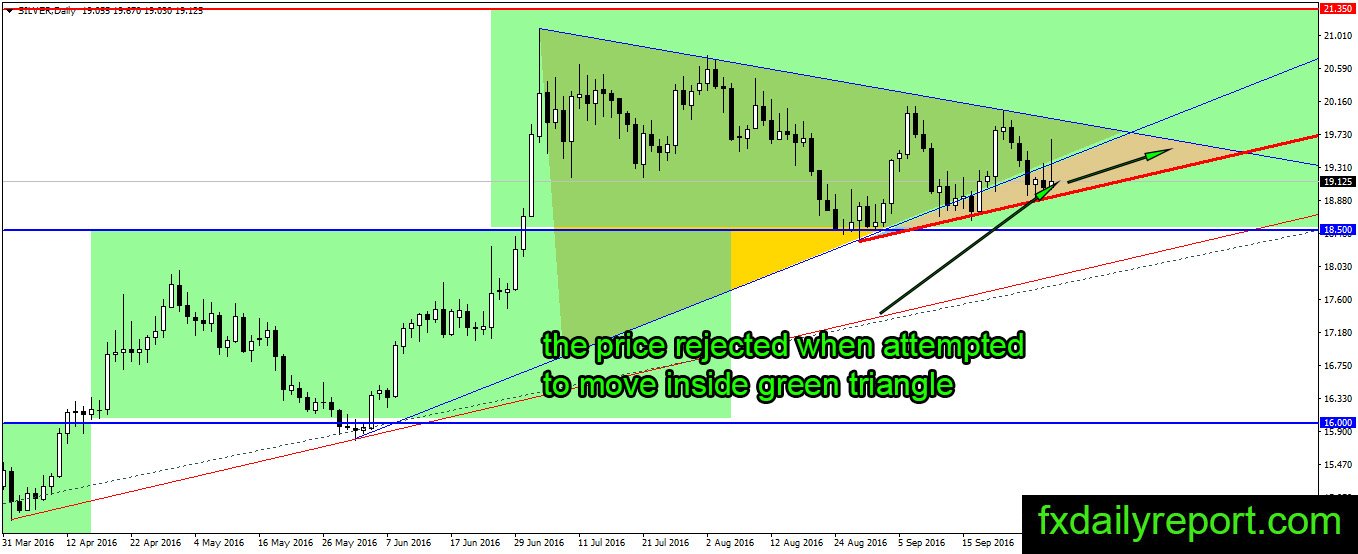
The bull will not like it to see bear winning as the price rejected when attempted to move inside the green triangle. The price might move inside the light red colored triangle, but it is also possible for it to close below it. Last Friday candle turned out as long legged doji means selling pressure was strong.
Trade plan
Bullish: Safest position could be taken between $18.25 – $18.50 with a stop below $18.00. The aggressive long position could be taken when price touched red trendline.
Bearish: Re-test of the green triangle or a close below red trendline will give good confirmation. However, with support near $18.25 – $18.50 a short trade should be treated as short term scalp until the price closed below it.