
Dow Jones Continues Slide as technical pressure persists
U.S. stock indices traded lower during intraday trading today. Meanwhile, rising Treasury yields continue to pressure broader equity valuations. The S&P 500 hovered near 7,705.13, slipping 0.90 points (-0.01%). Similarly, the Nasdaq Composite retreated from recent high levels. Meanwhile, the Dow Jones Industrial Average (DJIA) fell 152.75 points (-0.30%) to trade near 51,358.84.
Dow Jones Industrial Average
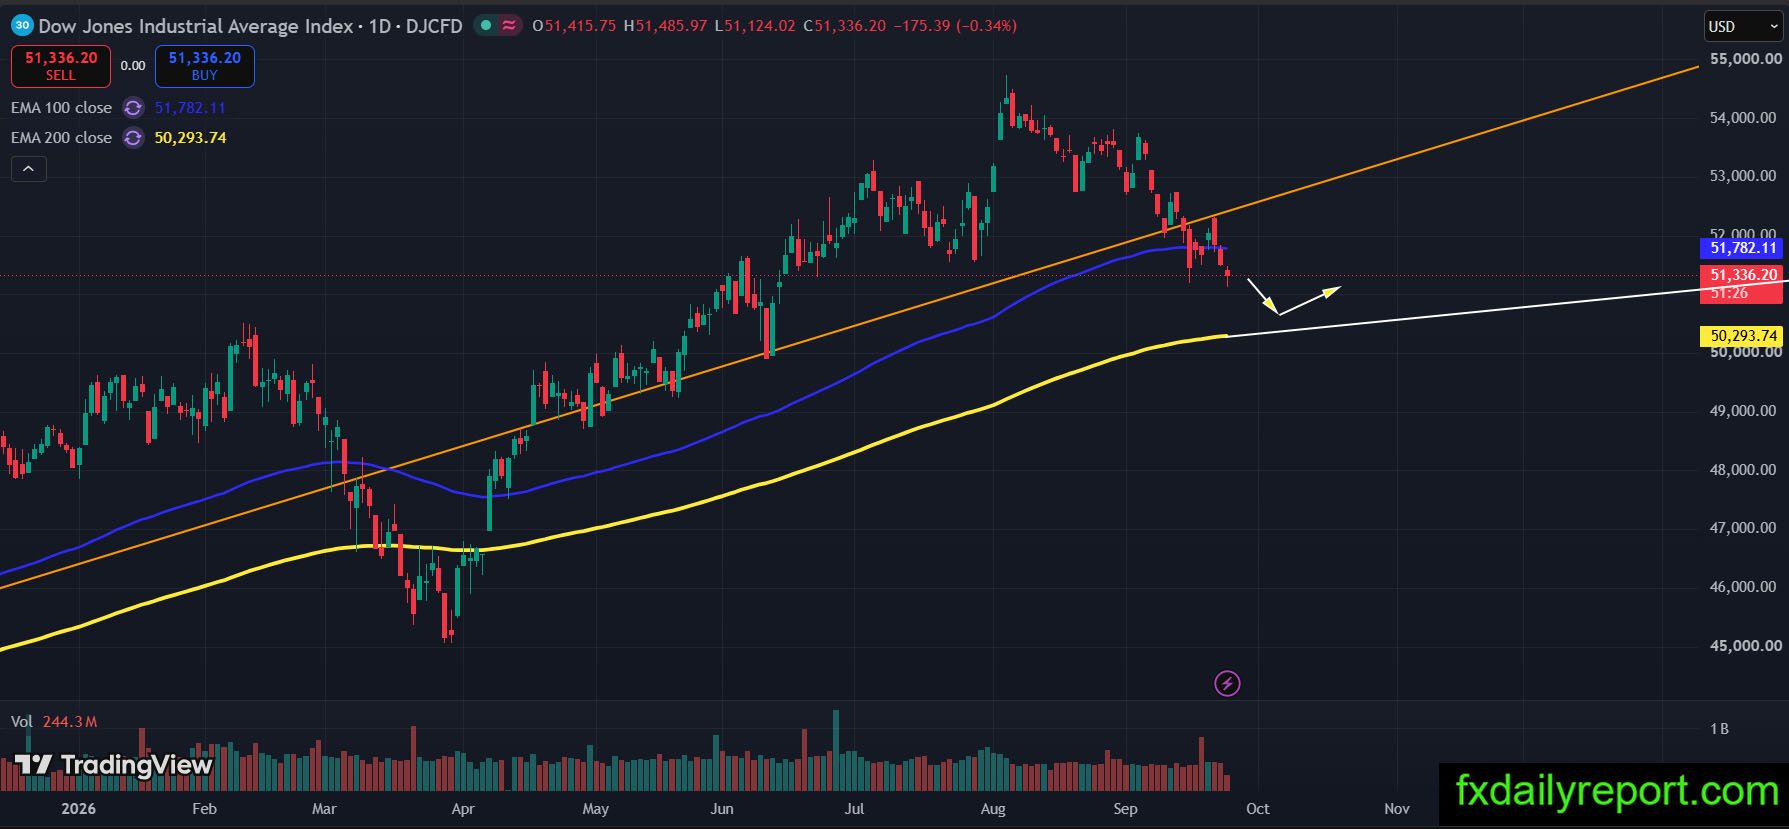

Dow Jones Industrial Average continues to print more lower lows. As a result, there is no structural change to the market situation yet. The index remains on a steady path lower toward its dynamic daily 200 EMA. Sellers maintain firm control following the recent break below the 100 EMA. Consequently, price action stays under steady downside pressure. Therefore, traders are closely watching the 200 EMA level for potential buyer defense.
Box, Inc. (BOX)
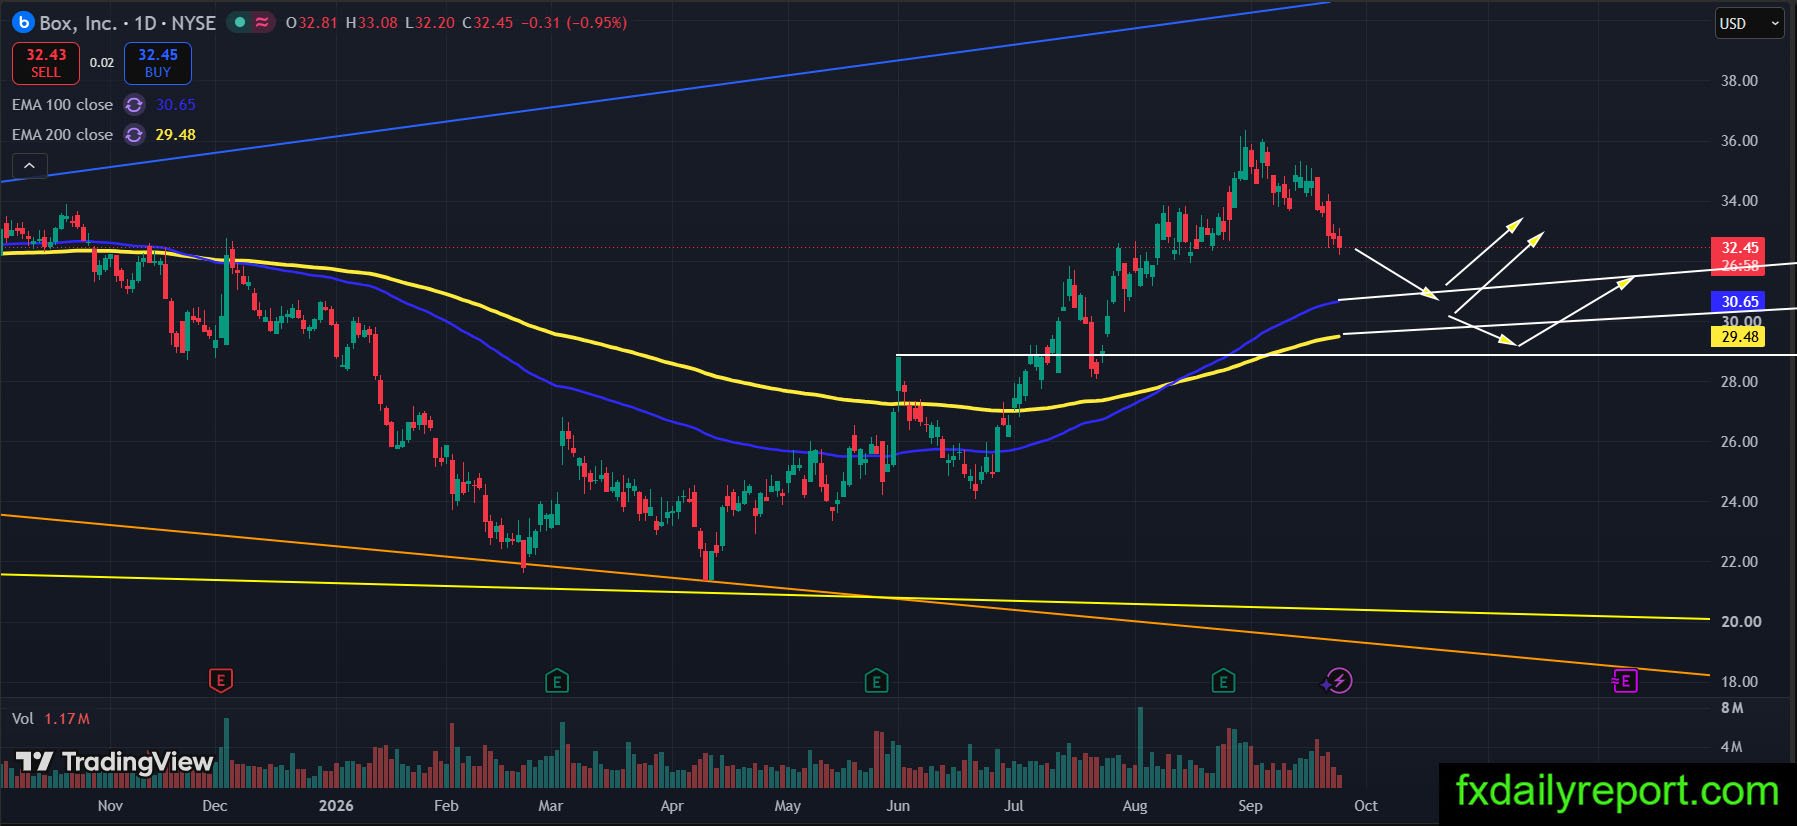
Box, Inc. (BOX) are also moving on a path lower today. Currently, share prices are targeting dynamic support at the daily 100 EMA and 200 EMA. Additionally, price could test the key horizontal support level around $28.50. Overall, this downward move represents a standard bearish correction toward major moving averages. Therefore, the overarching trend is expected to continue bullish after testing these support zones. However, a decisive daily close below $27.50 would become the first sign of trend invalidation.