
On Thursday, the WTI crude oil price bounced back from the session lows of about $93.93 to trade above $98 before pulling back to $96.18. The oil price trades within an ascending channel formation on the 60-minute chart.
The light crude oil price has now advanced to trade several levels above the 100-hour moving average line. However, Thursday’s late pullback prevented it from rallying into overbought levels of the 14-hour RSI.
WTI Crude Oil Fundamentals Overview

From a fundamental perspective, the light crude oil price trades during a relatively busy period in the market. While Trump promised an Iran ceasefire until at least November 3, that did not stop the Houthis from launching drone and missile attacks on Saudi Arabia, affecting oil shipping routes through the Red Sea and the Bab el-Mandeb Strait.
The Bab el-Mandeb Strait and the East–West Abqaiq–Yanbu crude oil pipeline, as well as oil facilities in Yanbu and Ras Tanura, were also affected. This has resulted in constrained oil supply, thus pushing oil prices higher.
In the latest US crude inventories, the API weekly crude oil stock for last week fell to -11.1 million, down from the previous week’s -2.1 million, below the forecast stock count of 1.9 million. On the other hand, the EIA crude oil stocks change for last week fell to -8.557 million, down from the preceding week’s equivalent of -3.186 million, below the forecast change of -0.3 million.
In the latest US economic data, the producer price index came in stronger than expected, with a (MoM) change of 1.3% versus a forecast of 0.5%, up from 0.5% in August. The (YoY) equivalent also beat the forecast of 5.3%, with a change of 6.3%, up from the previous month’s 5.6%.
WTI Crude Oil Technical Analysis (the 60-min Chart)
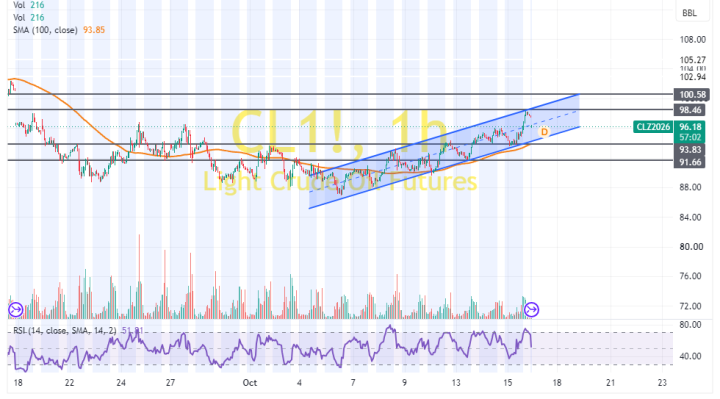
Technically, the WTI crude oil price trades within an ascending channel formation on the 60-minute chart. However, the 14-hour RSI has recently pulled back to recover from overbought conditions.
Therefore, the bears will look to extend the current pullback towards $93.83 or lower, down to $91.66. On the other hand, the bulls will look to pounce on extended gains at about $98.46 or higher, up to 100.58.
WTI Crude Oil Technical Analysis (the Daily Chart)
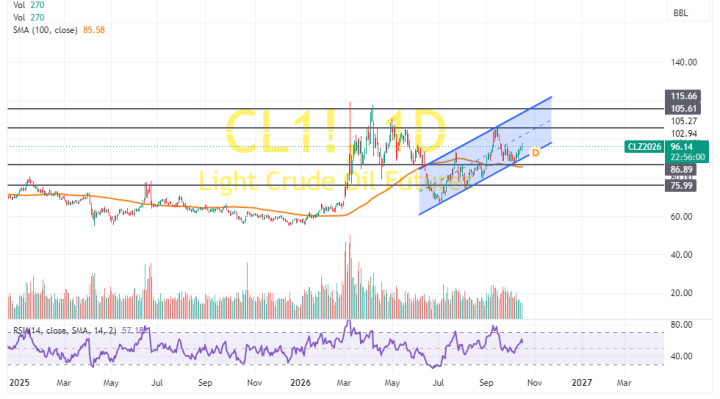
In the daily chart, the light crude oil price also trades within an ascending channel formation. The 14-day RSI has also recently bounced back to move closer to overbought conditions.
Therefore, the bulls will look to extend the current run of gains toward $105.61 or higher, up to $115.66. On the other hand, the bears will look to pounce on pullbacks at about $86.89 or lower, down to $75.99.