
WTI crude oil has staged an impressive rally after bouncing sharply off the swing low at $61.72, breaking above a near-term ceiling and surging past the Fibonacci retracement levels to trade around $66.70.
The Fibonacci retracement tool drawn from the recent swing high at $67.06 to the swing low at $61.72 shows the key levels that could come into play on a pullback. The 38.2% Fib is at $65.02, followed by the 50% level at $64.39.

A deeper correction could reach the 61.8% Fib at $63.76, which sits closer to where the 100 SMA and 200 SMA are converging as dynamic support. If any of these levels are able to keep losses in check, WTI crude could resume its climb back toward the swing high around $67.06 or higher.
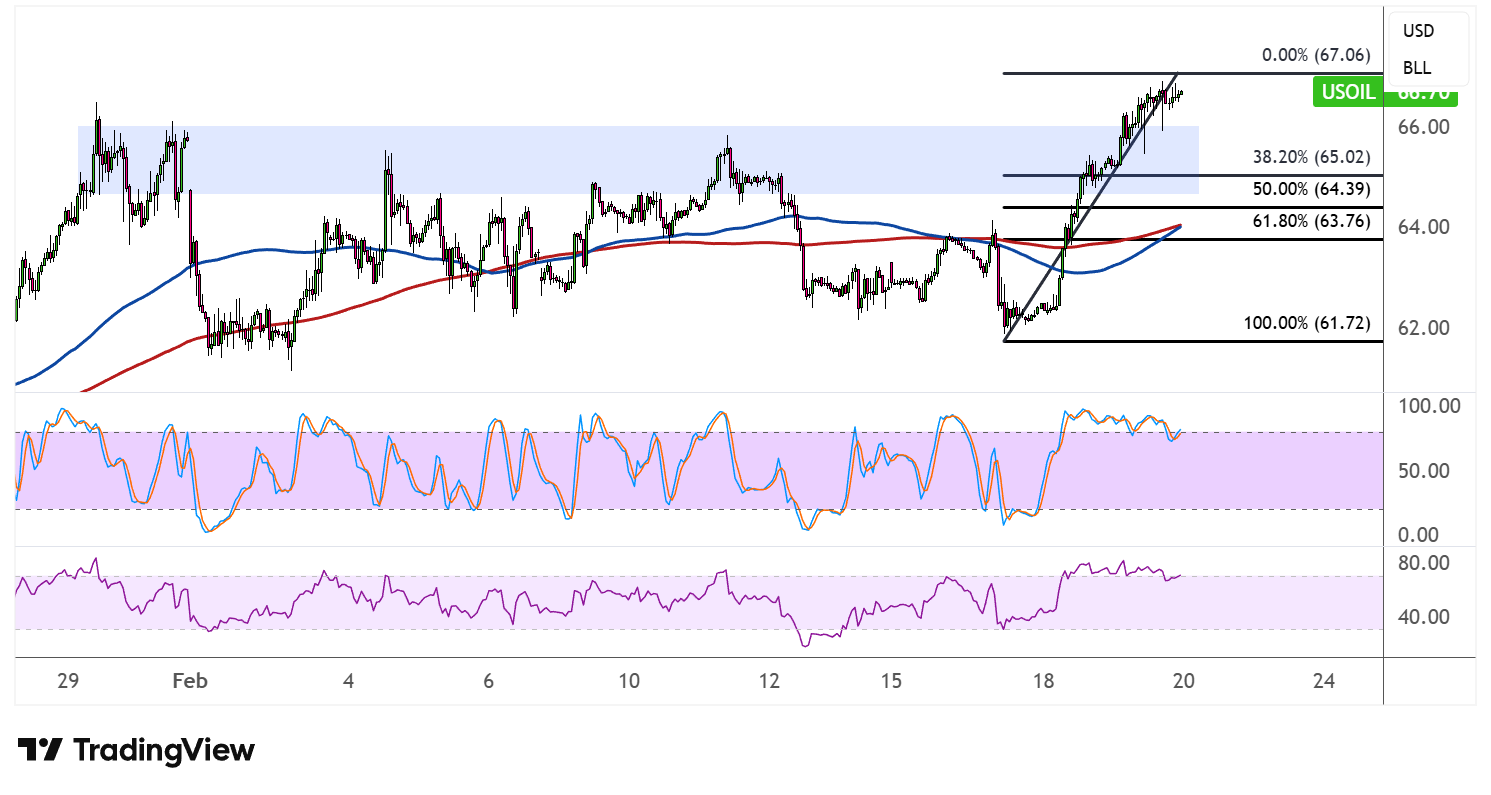
On the moving average front, the 100 SMA has crossed above the 200 SMA to confirm that the path of least resistance is to the upside, and both indicators appear to be sloping higher beneath current price action. This golden cross adds further weight to the bullish case and suggests that dips toward the moving averages could attract fresh buying interest.
However, stochastic is hovering near the overbought region after its sharp run higher, suggesting that bullish pressure could be starting to fade. A turn lower from here would signal a return of selling pressure, potentially triggering the pullback toward the Fibonacci support levels.
RSI similarly pushed deep into overbought territory during the rally and has since started to ease, leaving room for a corrective dip before buyers look to reload.
WTI crude oil is likely to take cues from inventory data and geopolitical developments, as supply-side concerns could either reinforce the bullish momentum or stoke further profit-taking near current highs. Fears of a US strike on Iran over the weekend are currently putting upward pressure on the energy commodity on fears that production and shipments could be halted.