
The price action of Bitcoin presently shows a promising movement in an ascending triangle pattern. This pattern indicates a potential breakdown or breakout in the upcoming days while Bitcoin is approaching a crucial horizontal resistance point at $70,000 in its supply zone due to which its price was held back concerning its trading against Tether.
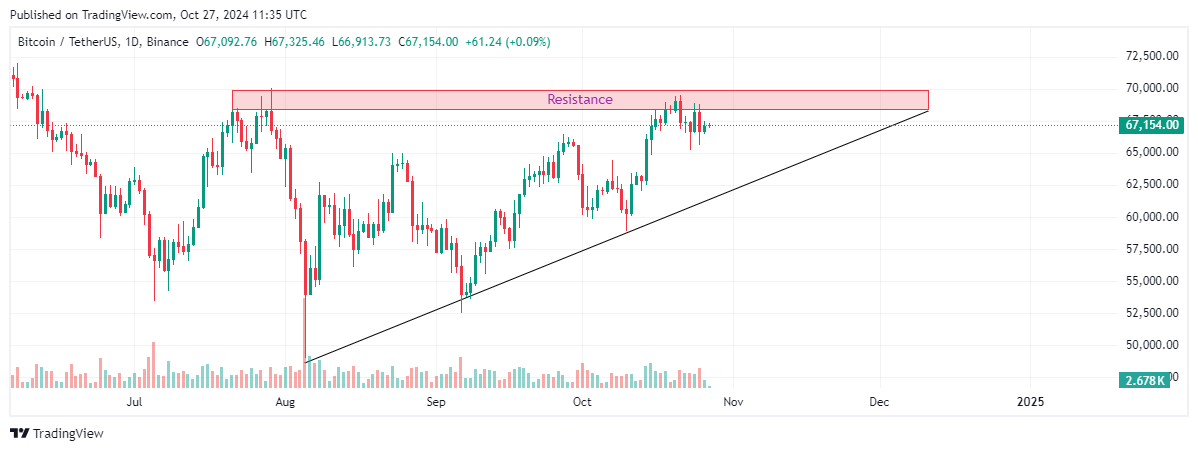
Bitcoin Price Likely Stands at the Edge of a Massive Move in an Ascending Triangle

This resistance level of Bitcoin, along with the upward trajectory that took place in recent times, signifies a substantial development. In this respect, it seems that the top crypto asset may be standing on the edge of a massive move. The ascending triangle works as a well-known pattern in the case of technical analysis. It usually indicates likely bullish momentum when buyers elevate the price of the asset to a horizontal resistance spot.
At the moment, the chief crypto asset is changing hands at nearly $67,066.94. This price level reportedly denotes a 0.08% price rise over the past twenty-four hours. On the other hand, in the recent week, the top crypto token has gone through a 1.67% dip in terms of price. However, in a slightly wider timespan, Bitcoin has seen a 2.50% price uptake.
Trending Now: Bitcoin Dominance Likely to Persist in Near Term: QCP Capital
Apart from considering the Ascending Triangle pattern, another significant indicator is the 21-day moving average of Bitcoin. This indicator also offers resilient support below the present price level of Bitcoin, lending more support to its bullish outlook. The 21-day moving average has been serving as a dependable indicator when it comes to short-term momentum. Hence, as long as the crypto asset maintains its position above 21MA, it denotes the triangle’s bullish structure.
21-Day Moving Average Offers Gradual Support, Assisting BTC to Break Through Resistance
The formation of the triangle pattern occurs combined with the gradual support that the 21MA provides. Both these factors mutually signify the potential of the buyers to push the price of Bitcoin above the resistance barrier. Nevertheless, Bitcoin can fail to break through this level. In such a case, the support could decline. This scenario could lead to a likely breakdown below the above-mentioned triangle pattern, indicating a directional shift.