
Gold Jumps 1% on Softer US Dollar, Lower Treasury Bond Yields
Gold futures rose 1% to above $4,200 per ounce on a tepid US dollar and lower Treasury yields. The yellow metal has been entrenched in…

Gold futures rose 1% to above $4,200 per ounce on a tepid US dollar and lower Treasury yields. The yellow metal has been entrenched in…
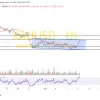
On Friday, the gold price bounced back from the session lows of about $4,136 to trade at about $4,184 after the latest US data. XAU/USD…

Gold: Strong Reaction at Green Box Support Signals Potential Bounce Gold produced a strong bullish reaction within the green box support area ($4,110 – $4,170)…
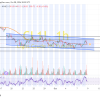
On Thursday, the WTI crude oil price pulled back from the session highs of about $93.36 to trade at about $90.71. The oil price trades…
Gold: Consolidation Persists Inside $4,110 – $4,170 Support Range Gold continues to consolidate inside the green box support area ($4,110 – $4,170) following recent volatility….

Crude oil futures jumped 4% on Thursday after reports surfaced that President Donald Trump would renew military strikes on Iran after the November midterm elections….

Crude oil futures were down slightly to kick off the trading week as investors monitor Middle East exports and the release of emergency stockpiles by…
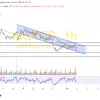
On Friday, the gold price pulled back from the session highs of about $4,227 to trade at about $4,143 after the latest US data. XAU/USD…