
Natural gas has been carving out fresh lows within a steep descending channel but appears to be staging a recovery attempt from the swing low around the $2.584 level. Price is currently hovering near $2.686, attempting to push higher as buyers step back in after the prolonged slide.
The immediate area of interest is the cluster of Fibonacci retracement levels drawn from the recent swing high to swing low. The 38.2% Fib sits at $2.801, which also lines up closely with the lower boundary of a previously broken support zone.

A sustained move above this could open the door to the 50% Fib at $2.868, then the 61.8% level at $2.935. The more significant ceiling, however, is the descending trend line resistance, currently converging near the upper Fibonacci levels, which could cap any recovery attempts.
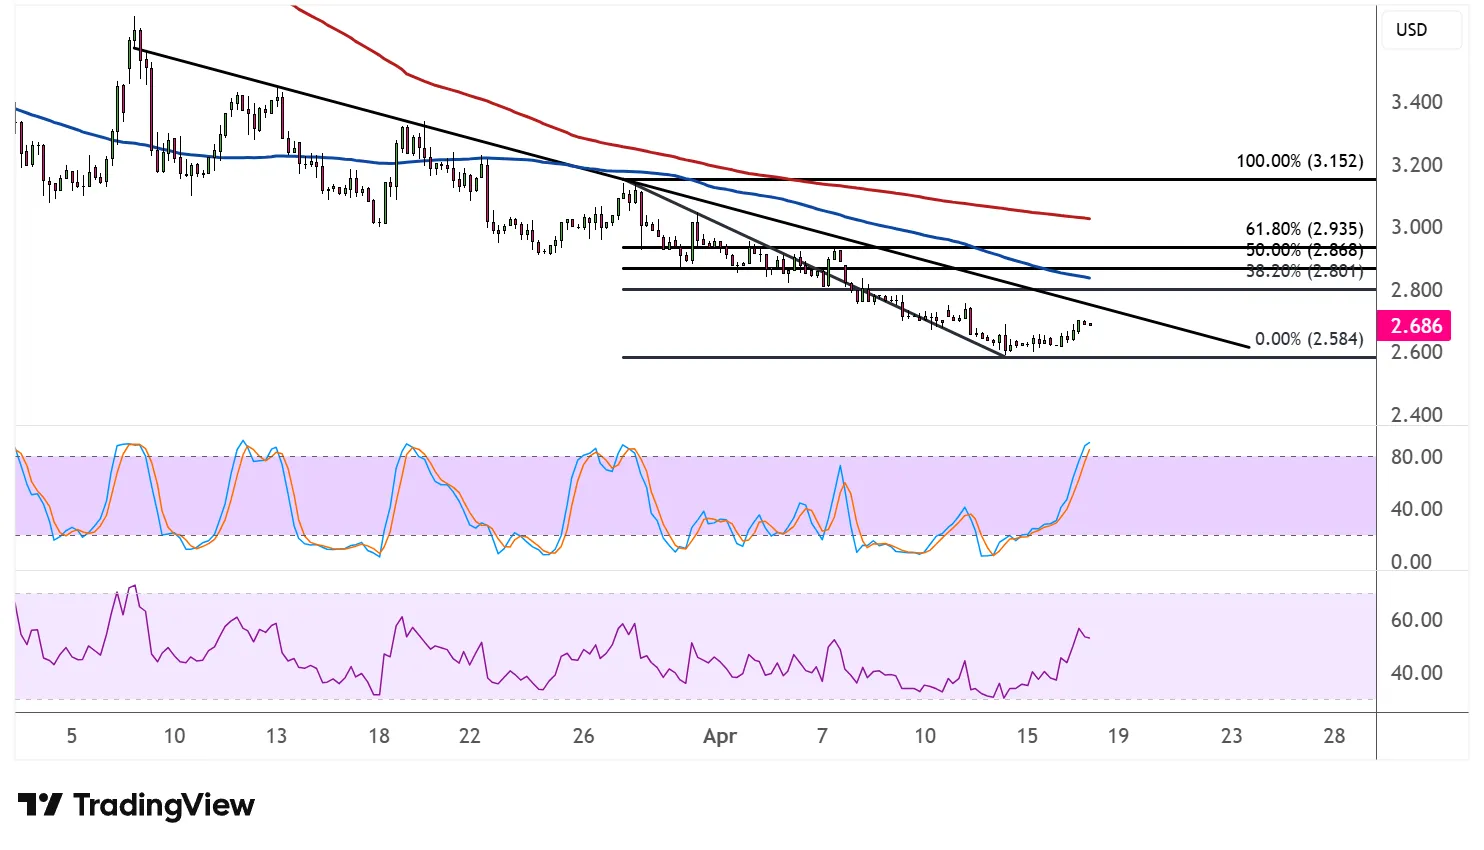
The 100 SMA remains below the 200 SMA, confirming that the path of least resistance is still to the downside and that any pullback is more likely a corrective move than a full-blown reversal. Both moving averages are sloping lower and could act as dynamic resistance on any bounce.
Stochastic is charging higher and approaching the overbought region, suggesting that bullish momentum is building for now but could start to fade as the oscillator nears those elevated levels. A bearish crossover from overbought territory would signal that sellers are gearing up to reassert control.
RSI is also on the climb but still has room to run before reaching overbought conditions, leaving the door open for further upside in the near term. A break above the trend line and Fib levels could mark the start of a reversal from the downtrend.
Natural gas could take cues from inventory data and broader energy demand signals. A larger-than-expected draw in stockpiles could fuel the bounce further, while a build would likely reinforce the bearish trend.