
Natural gas is pulling back from recent lows around the $2.584 swing bottom, with price currently nudging higher to $2.686 while still trading inside a descending channel on the short-term time frame.
The series of lower highs and lower lows connected by the channel’s parallel trend lines keeps the broader bias tilted to the downside for now. The ongoing bounce could be testing the Fibonacci retracement levels drawn from the swing high near $3.152 down to the $2.584 low.

The 38.2% Fib sits at $2.801, followed by the 50% level at $2.868. A larger corrective move could extend all the way to the 61.8% Fib at $2.935, which lines up closely with the descending channel resistance and could act as a formidable ceiling for any recovery attempt.
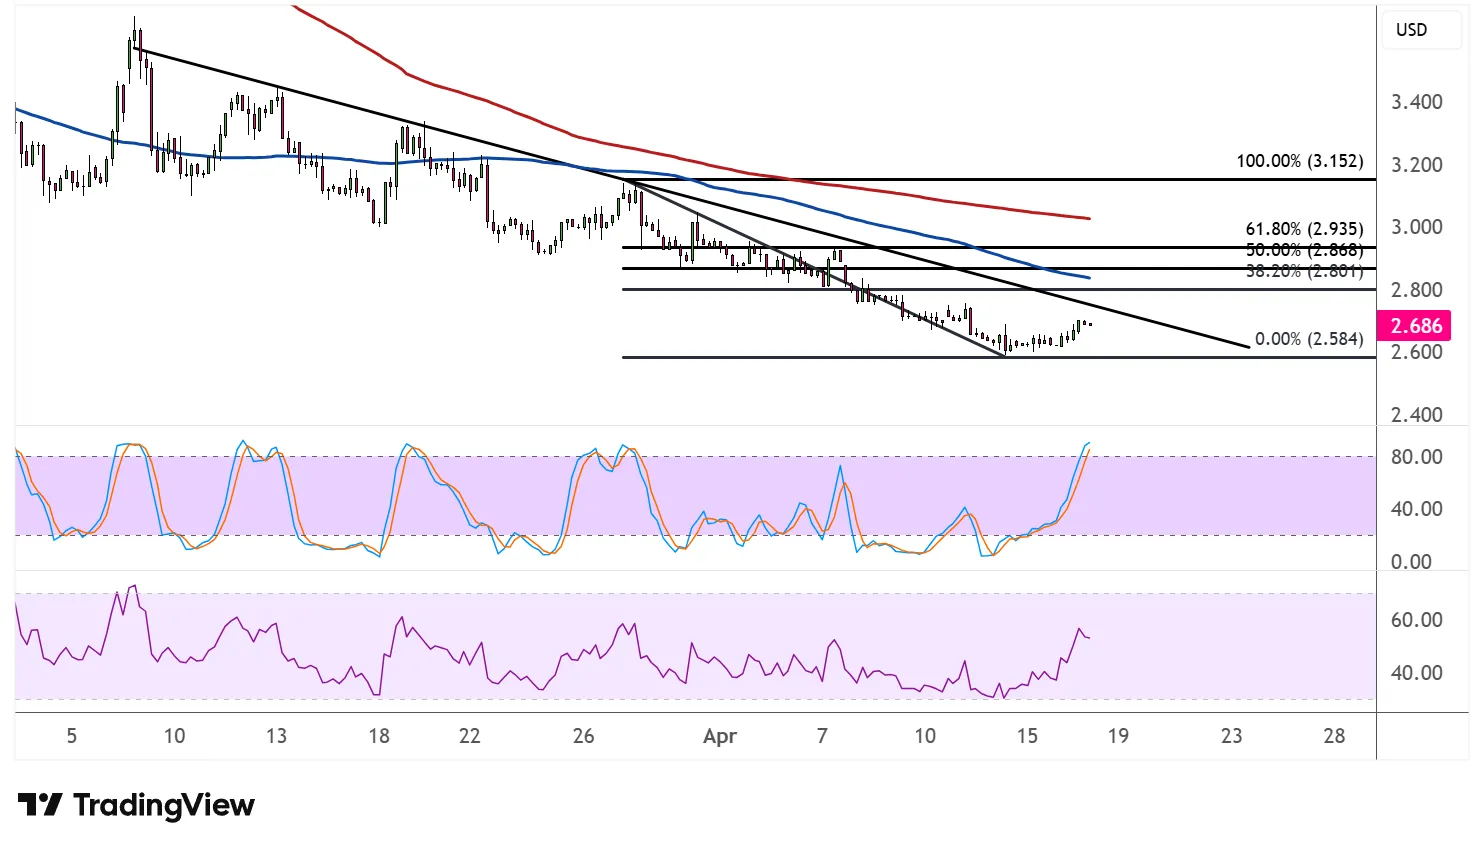
On the subject of moving averages, the 100 SMA remains below the 200 SMA to confirm that the path of least resistance is still to the downside, or that the broader selloff could eventually resume. Both moving averages are sloping lower and converging with the channel resistance, reinforcing the overhead supply zone between the 50% and 61.8% Fibs.
Stochastic is sharply on the rise and approaching the overbought region, suggesting that bullish momentum from the bounce is already starting to fade. A turn lower from this area would signal that sellers are gearing up to regain control.
RSI is also climbing and has some room left before reaching overbought territory, so price could inch a bit higher before running into resistance. Still, the oscillator has been unable to sustain moves above the midpoint throughout the downtrend, keeping the bearish bias intact.
If any of the Fib levels cap the recovery, natural gas could resume its slide back toward the $2.584 swing low or set fresh lows below the channel. The energy commodity could take cues from inventory data and weather forecasts, which would paint the supply-demand picture in the near-term.