
USDX (USD Index)
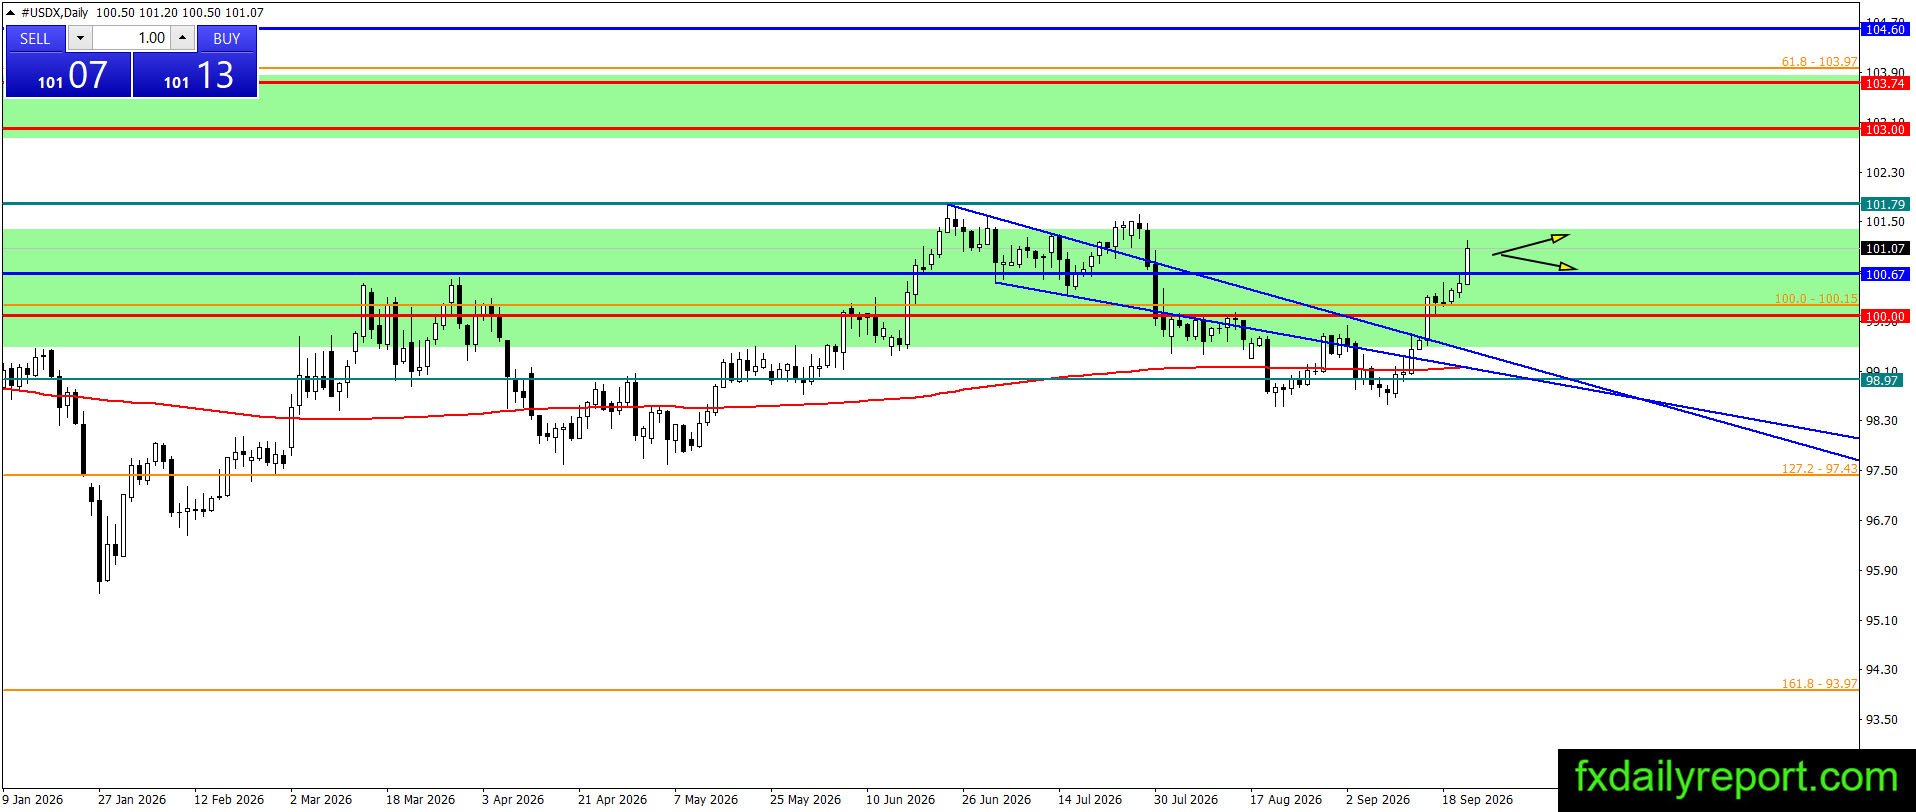
U.S. Dollar Index (USDX) is displaying strong bullish momentum, climbing decisively above the 100.67 horizontal level. Price action suggests the index is aiming for the previous swing high near 101.50 – 101.79. A confirmed breakout and print of a new higher swing high will serve as technical confirmation that the broader bullish trend remains intact and likely continues over the near term.
EUR/USD

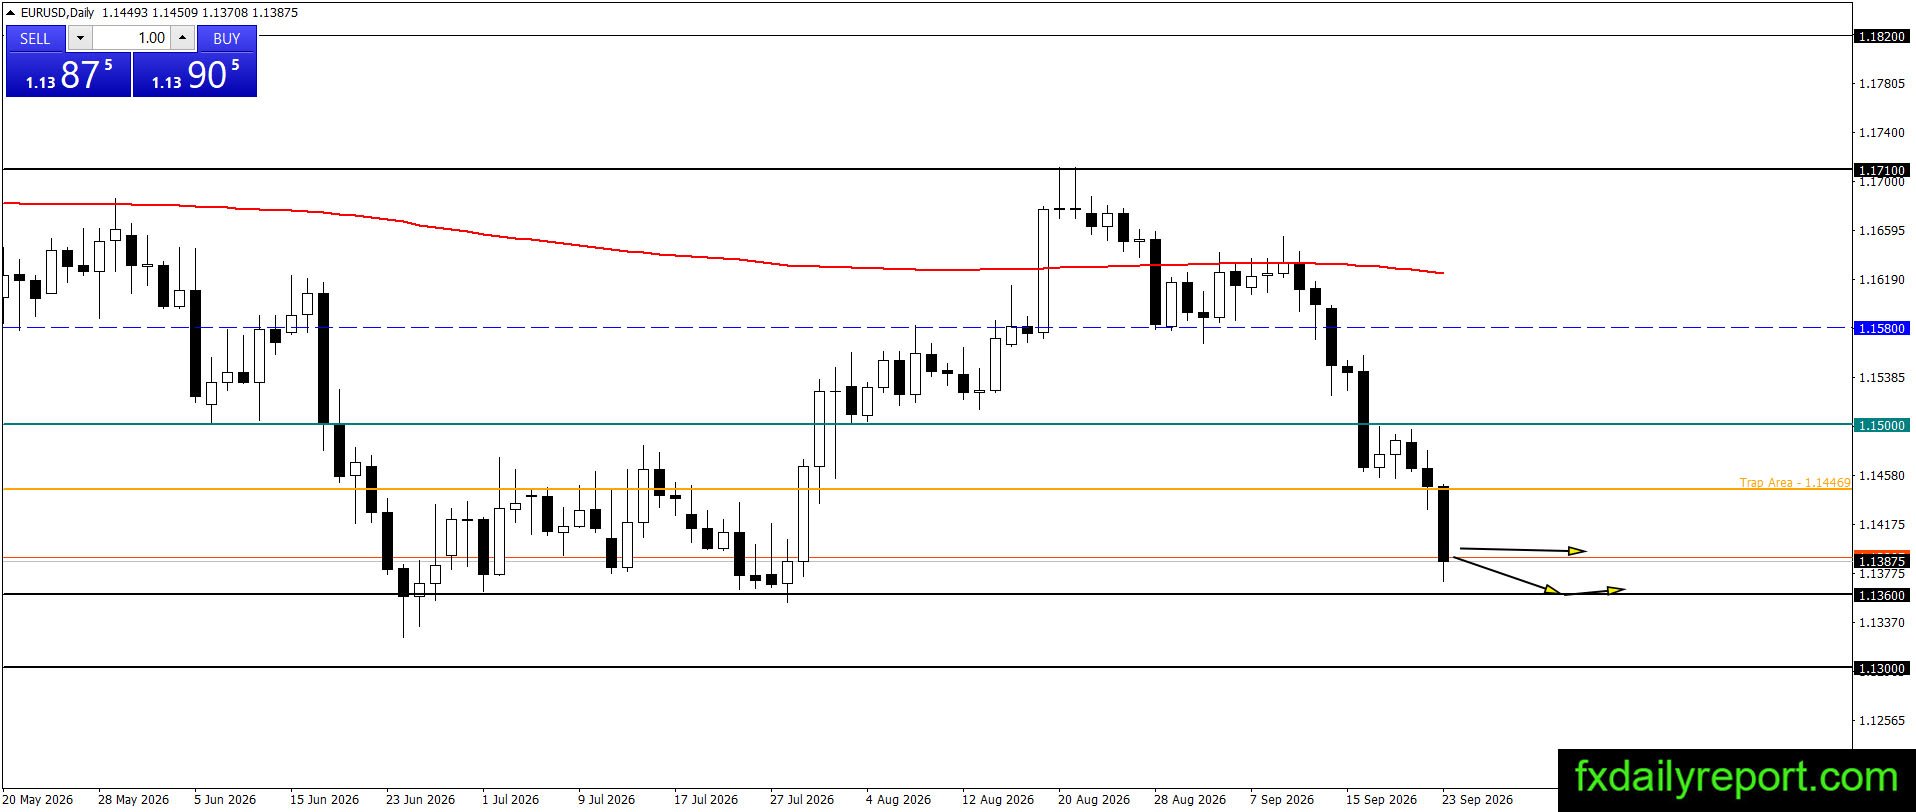
EUR/USD remains under severe selling pressure after breaking below the 1.1447 trap area, now fast approaching the 1.1360 primary support level. Bulls are struggling to defend current price levels. A decisive daily breakout and close below 1.1360 will confirm that buyers have lost control, opening the door for further extension of the bearish trend down toward 1.1300.
Today’s critical levels to watch:
Support: 1.1360, 1.1300
Resistance: 1.1500, 1.1580, 1.1710, 1.1820, 1.2000, 1.2070
GBP/USD
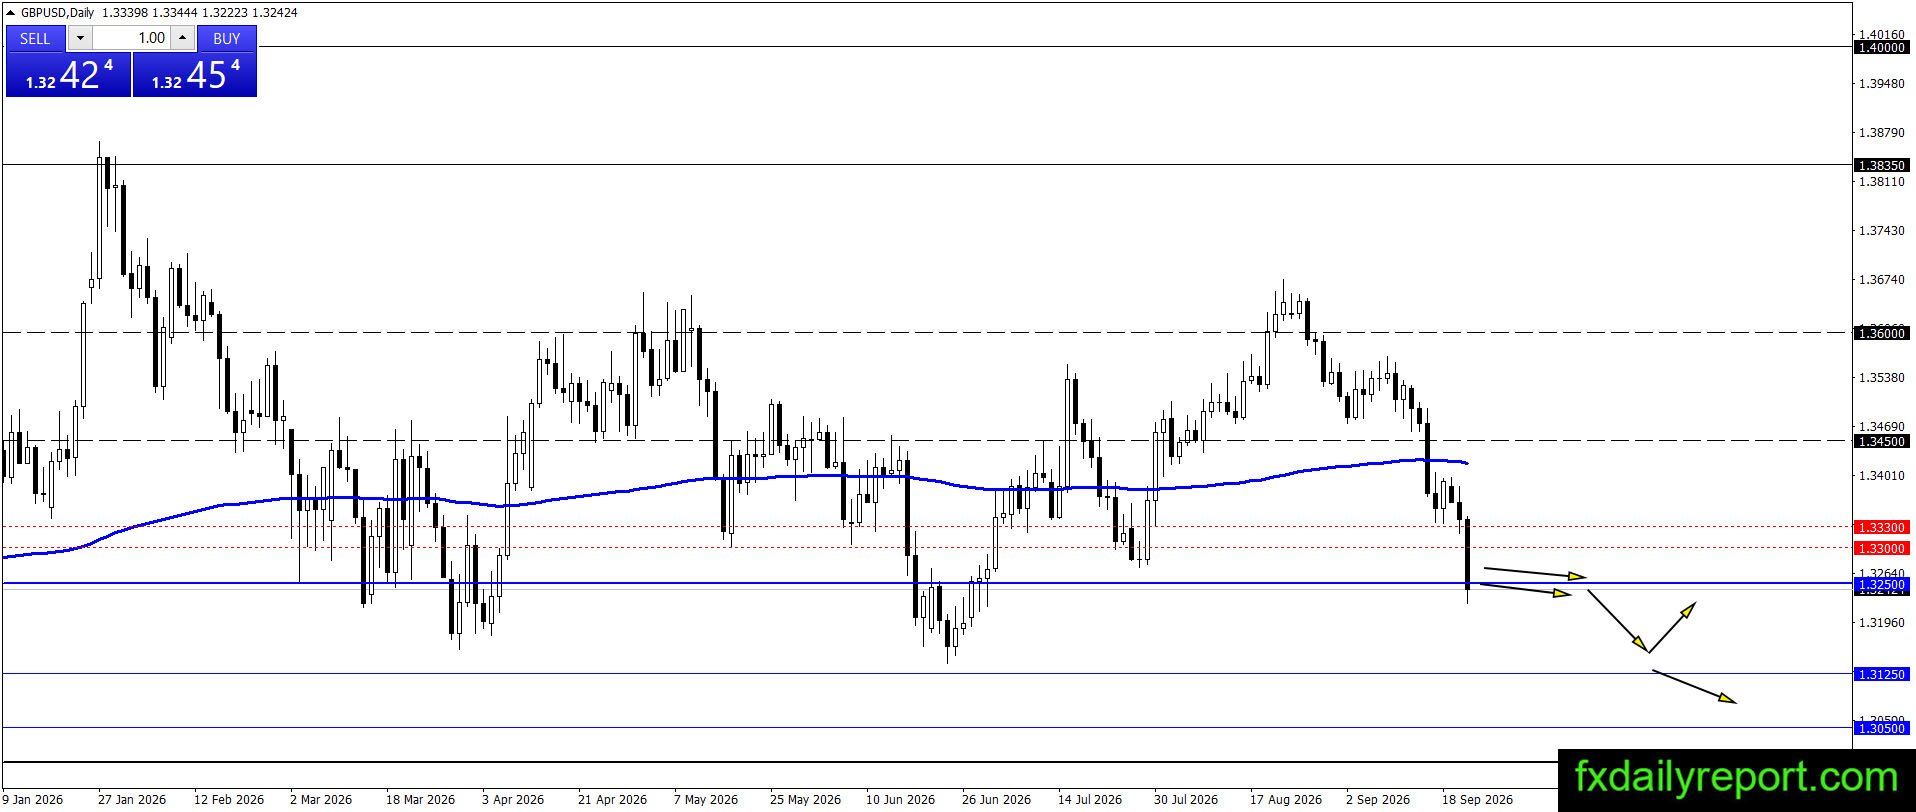
GBP/USD experienced a sharp sell-off, slicing straight through the critical 1.3300 – 1.3330 support zone and the daily 200 SMA. The pair is currently trading near 1.3250. Sellers maintain a firm grip on the pair’s direction. Continued weakness below 1.3250 will likely accelerate the decline toward testing the next key swing low at 1.3139.
Today’s critical levels to watch:
Support: 1.3330, 1.3300, 1.3250
Resistance: 1.3450, 1.3600
USD/JPY
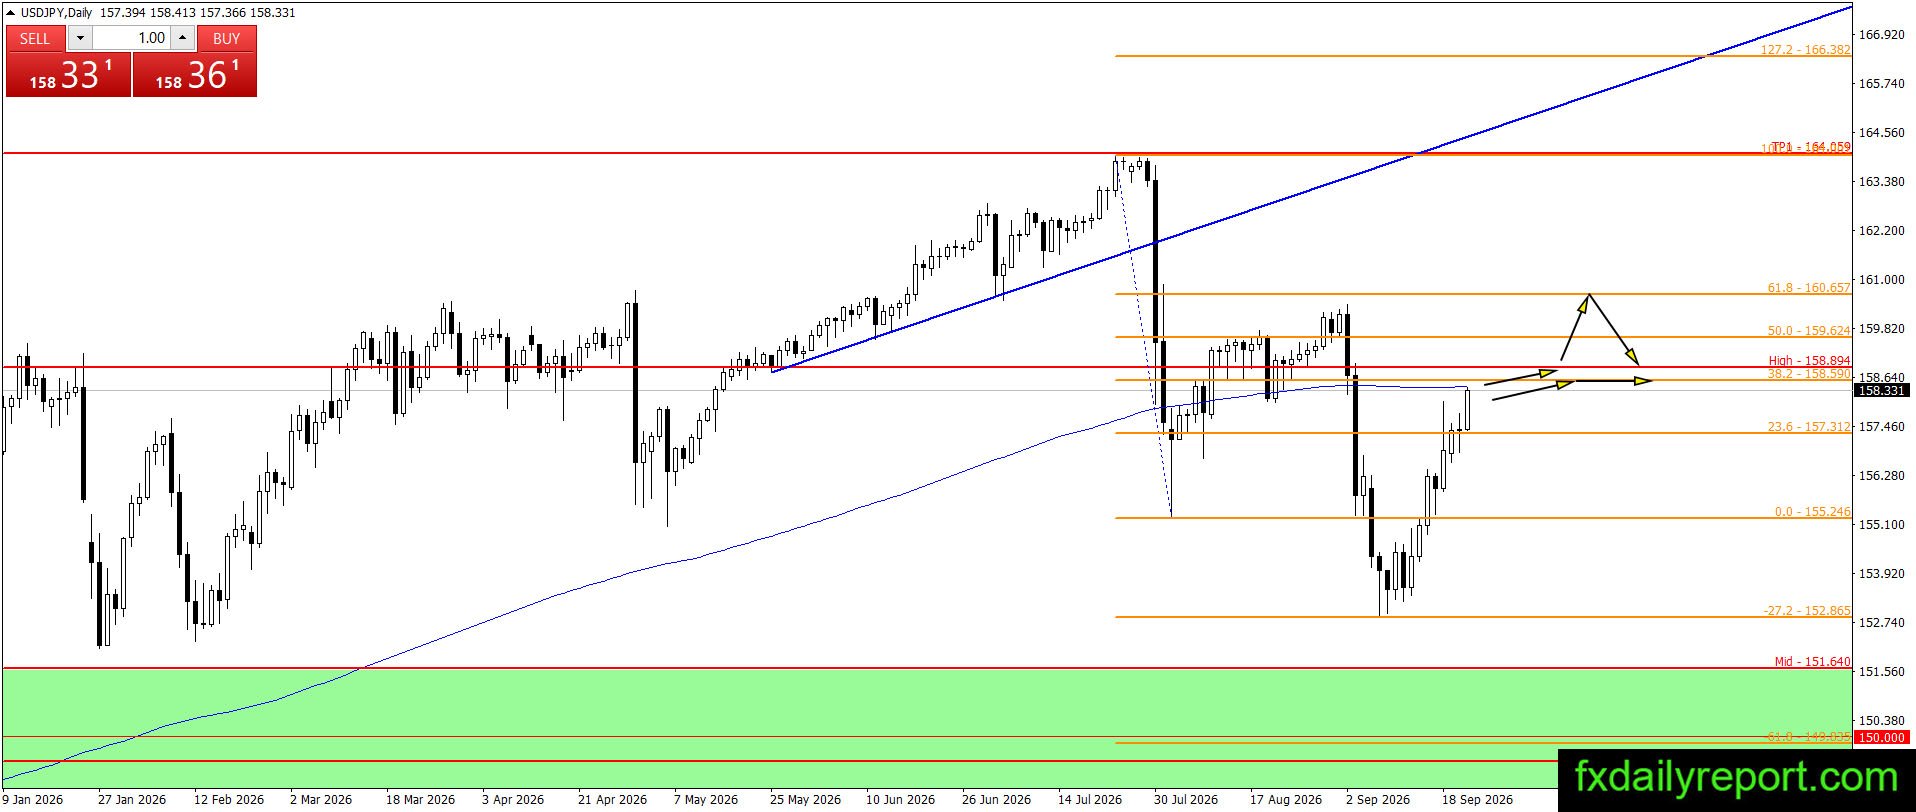
The bullish correction in USD/JPY continues to gather steam, driving the pair directly into the daily 200 SMA dynamic resistance near 158.33. If the 200 SMA fails to halt the upward push, the pair could extend its rally toward the major swing high target around 160.40 – 160.65. However, traders are advised to wait for clear bearish rejection signals around current resistance before taking short positions.
Today’s critical levels to watch:
Support: 155.50, 154.00, 150.00
Resistance: 158.89
AUD/USD
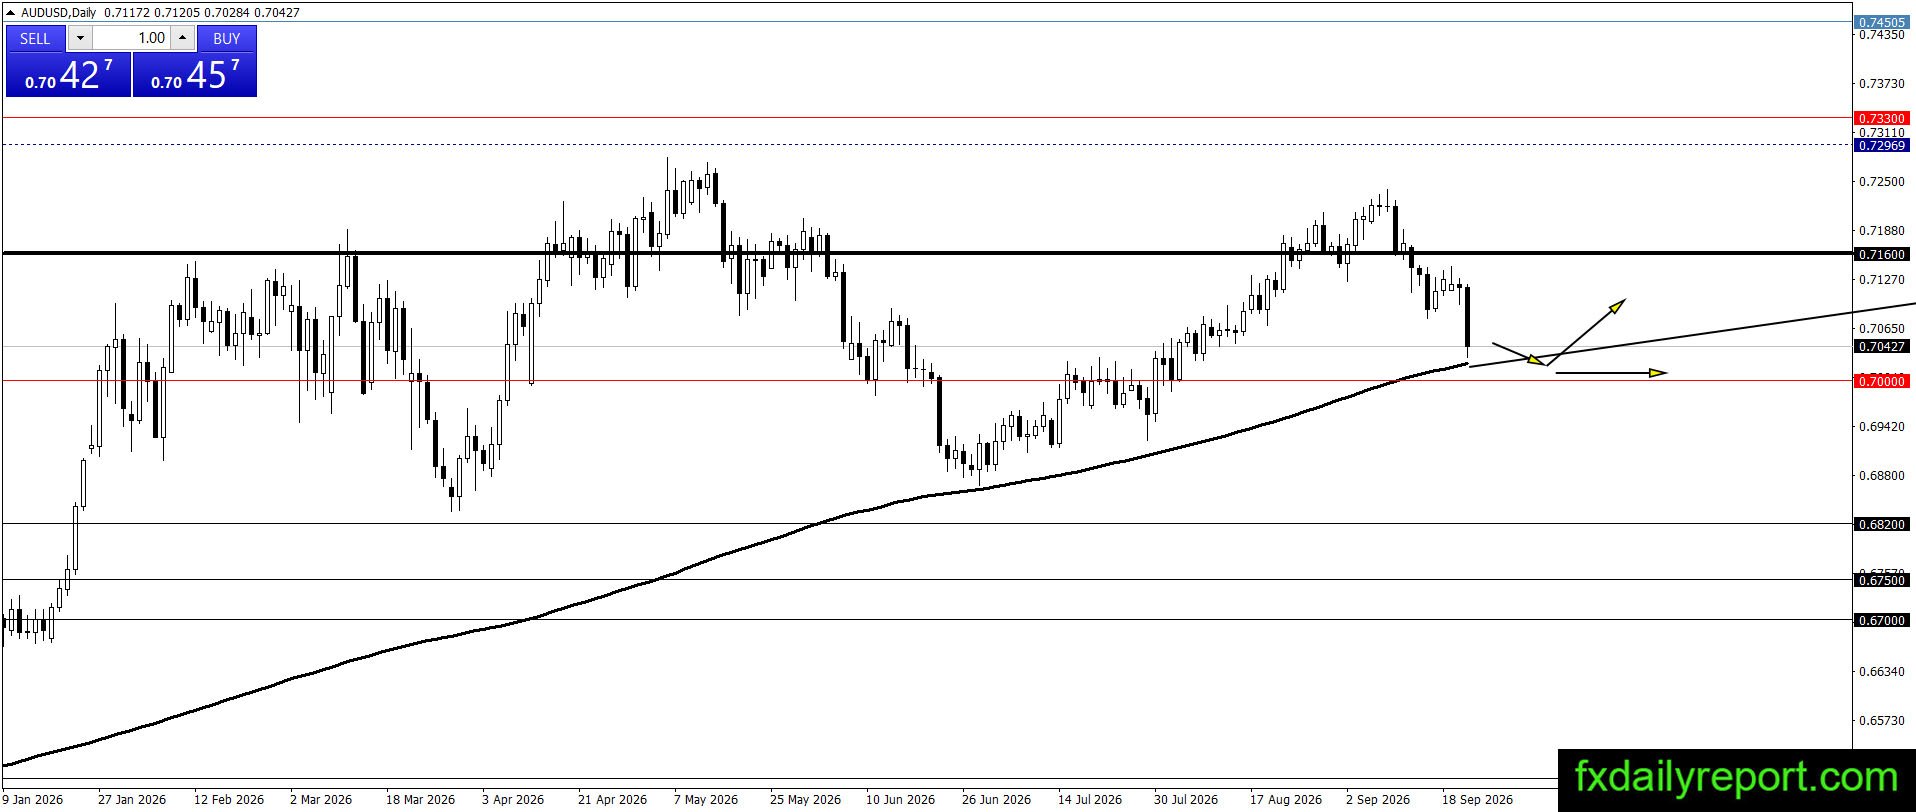
AUD/USD suffered a steep drop from the 0.7160 resistance area, descending rapidly toward the dynamic support of the daily 200 SMA and the 0.7000 psychological boundary. Due to the strong bearish momentum behind this move, immediate position-taking carries elevated risk. Observing price action for bottoming patterns or rejection candles around the 0.7000 handle and 200 SMA will offer better risk-defined long entry opportunities.
Today’s critical levels to watch:
Support: 0.7000, 0.6820, 0.6750, 0.6700, 0.6600
Resistance: 0.7160, 0.7300, 00.7330