
The price of gold (XAU/USD) spiked on Tuesday and Wednesday to refresh its current multi-year highs after topping $1,491. The price of the yellow metal has been on a bullish run since pulling back to bottom at around $1,400 at the start of the month.
Gold prices traded in a sideways movement during July, but the month of August appears to have brought in a renewed optimism in the yellow metal amid growing concerns that the US-China trade war could escalate and send shockwaves throughout the global economy.
XAU/USD (Gold) Fundamentals Overview

From a fundamental perspective, gold bulls appear to have gained more optimism following the events of last week and the subsequent economic data that followed thereafter.
Last week, the US Federal Reserve cut the base interest rate by 25 basis points as a precaution towards a potential economic slowdown.
While the US economy has stood firm over the last few years, even when global economies struggled, the risk of exposure is becoming more severe, which is why the Fed has to cut rates to stimulate investments in the economy.
Furthermore, with Trump announcing 10% trade tariffs on $300 billion worth of Chinese products, the market fears that China will exert the same measures on US products thereby triggering an escalation of the trade war potentially to other countries.
These factors accompanied by a mixed bag of economic data over the last few days have contributed to the sharp spike in gold prices.
XAU/USD (Gold) Technical Analysis (the 60-min Chart)
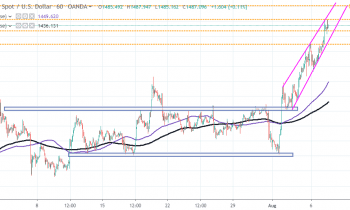
From a technical perspective, the price of gold (XAU/USD) appears to be trading in a sharp ascending channel, which illustrates a short-term bullish bias. Before the current trend, the price of gold traded within a fairly sideways channel as it struggled to find a rhythm.
The current bullish run has created some interesting trading opportunities for both the bulls and the bears. The bulls will target short-term profits at around $1,491 or higher at the key level $1,500 while the bears will hope for a short-term rebound towards $1,480 or lower at key support $1,450.
XAU/USD (Gold) Technical Analysis (the Daily Chart)
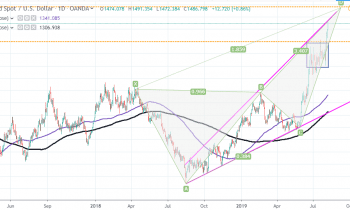
In the daily chart, the price of gold (XAU/USD) appears to be on the way to complete a bullish XABCD pattern. The yellow metal appears to have shaken off the short-term consolidation pattern ($1,400-$1,450) after stretching recently to trade within touching distance of $1,500.
This creates long-term trading opportunities at $1,520 for the bulls while the bears will look to pounce at around $1,450 in case of a major pullback.
In summary, the price of gold (XAU/USD) appears to be enjoying strong bullish bias both in the short-term and in the long-term. However, the bears will be targeting any pullbacks along the way.