
The Bitcoin price on Thursday bounced off the 100-hour moving average line at about $37,516 to trade at about $37,726. The BTC/USD appears to be trading within a gently descending channel formation in the 60-min chart.
The price of the pioneer cryptocurrency has now advanced to trade above the 100-hour MA. However, Bitcoin still seems to have a lot of room left to run before escaping the normal trading range in the 14-hour RSI.
Bitcoin Price Fundamentals Overview

From a fundamental perspective, the BTC/USD is trading at the back of a relatively busy period in the market. In an SEC filing seen on Thursday, Microstrategy revealed that it bought 16,130 bitcoin bringing its total BTC stash to 174,530 as of November. The latest purchase increased its holdings by 10%. This follows $147.3 million of additional Bitcoin bought disclosed in September. According to the latest filing, the company is now $1.3 billion “in the money” from its BTC holdings.
In the latest US economic data, the personal consumption expenditures-price index for October missed the (MoM) expectation of 0.1% with a change of 0%. The (YoY) equivalent matched the estimate of 3%. On the other hand, the core personal consumption expenditures-price index was in line with both the (MoM) and (YoY) expectations of 0.2% and 3.5%, respectively.
Elsewhere, the Chicago Purchasing Manager’s Index for November beat the expected reading of 45.4 with a reading of 55.8. Pending home sales for October exceeded the expectation of -2% with a change of -1.5%, while the initial jobless claims for last week beat 220k with a tally of 218k.
Bitcoin Price Technical Analysis (the 60-min Chart)
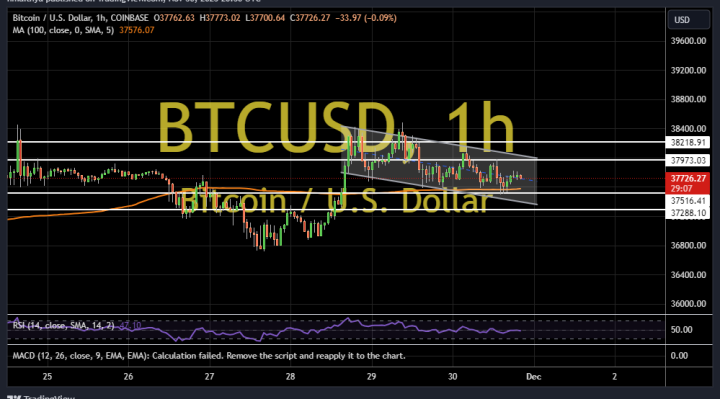
Technically, the price of bitcoin appears to be oscillating within a gently descending channel formation in the 60-minute chart. This indicates a slight short-term bearish bias in the market sentiment.
Therefore, the bears will be looking to extend the current declines toward $37,516 or lower to $37,288. On the other hand, the bulls will look to pounce on rebounds at about $37,973 or higher at $38,218.
Bitcoin Price Technical Analysis (the Daily Chart)
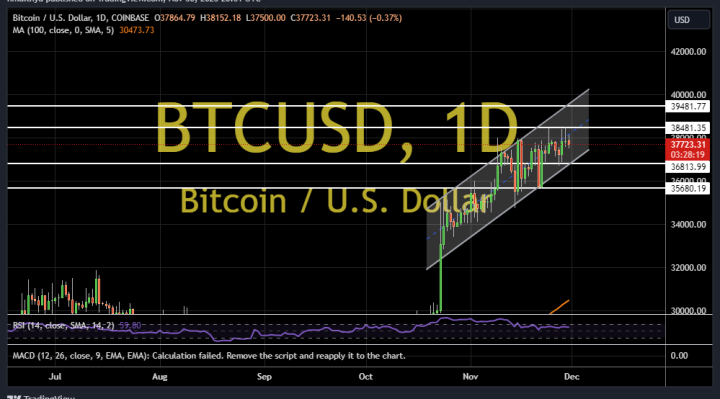
In the daily chart, the price of the pioneer cryptocurrency appears to be trading within an ascending channel formation. The 14-day RSI also seems to support a bullish bias as it moves closer to the overbought levels.
Therefore, the bulls will be looking to ride the current rally towards $38,481 or higher to $39,481. On the other hand, the bears will look to pounce on pullbacks at about $36,813 or lower at $35,680.