
EUR/JPY
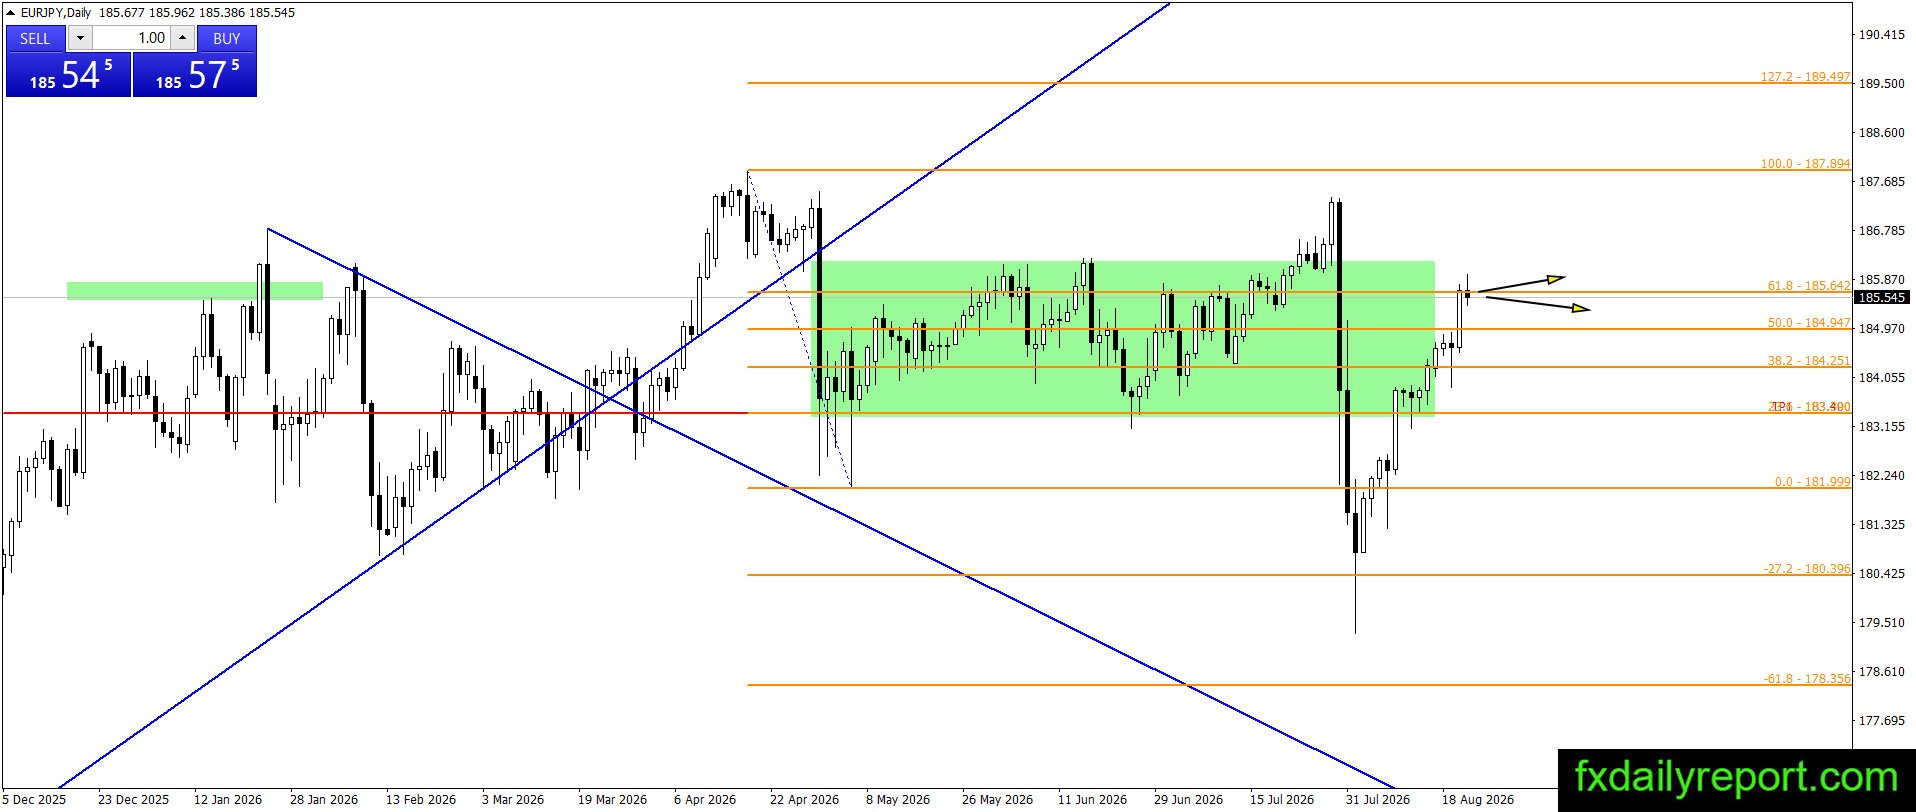
The bullish correction in EUR/JPY continues to make headway, with price action pressing into the 61.8% Fibonacci retracement level near the upper boundary of the key resistance zone between 183.30 and 185.64. Despite reaching this technical region, there is currently no concrete evidence of a bearish reversal taking shape. Price behavior inside this resistance zone should be monitored for a clear daily swing high or trend shift indicator before assessing potential short scenarios.

Today’s critical levels to watch:
Support: 183.40, 180.00
Resistance: 185.84, 190.00
EUR/GBP
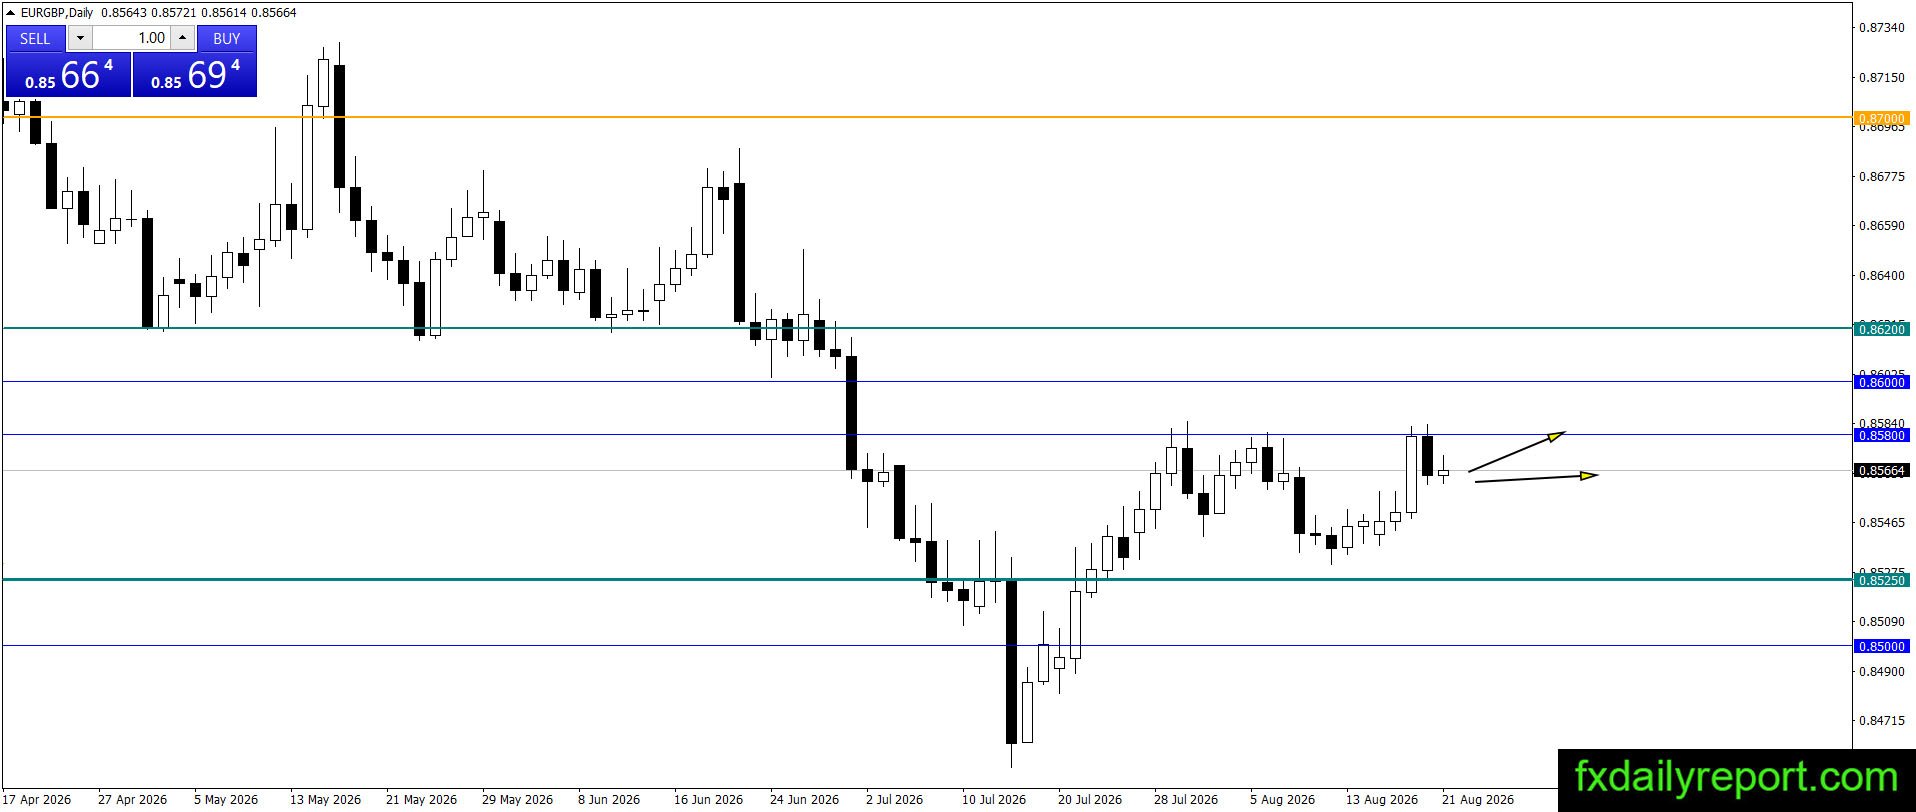
EUR/GBP experienced a minor rejection after testing the 0.8580 resistance level, though selling pressure still lacks strong momentum. The pair is currently hovering around 0.8566, placing it at a pivotal juncture between a bullish expansion toward the 0.8620 resistance handle and a bearish continuation toward support at 0.8525 if a lower swing low is printed. A decisive breakout or a confirmed trend shift indicator around 0.8580 is needed to clarify the next directional leg.
Today’s critical levels to watch:
Support: 0.8525, 0.8500
Resistance: 0.8580, 0.8600, 0.8700, 0.8750
GBP/JPY
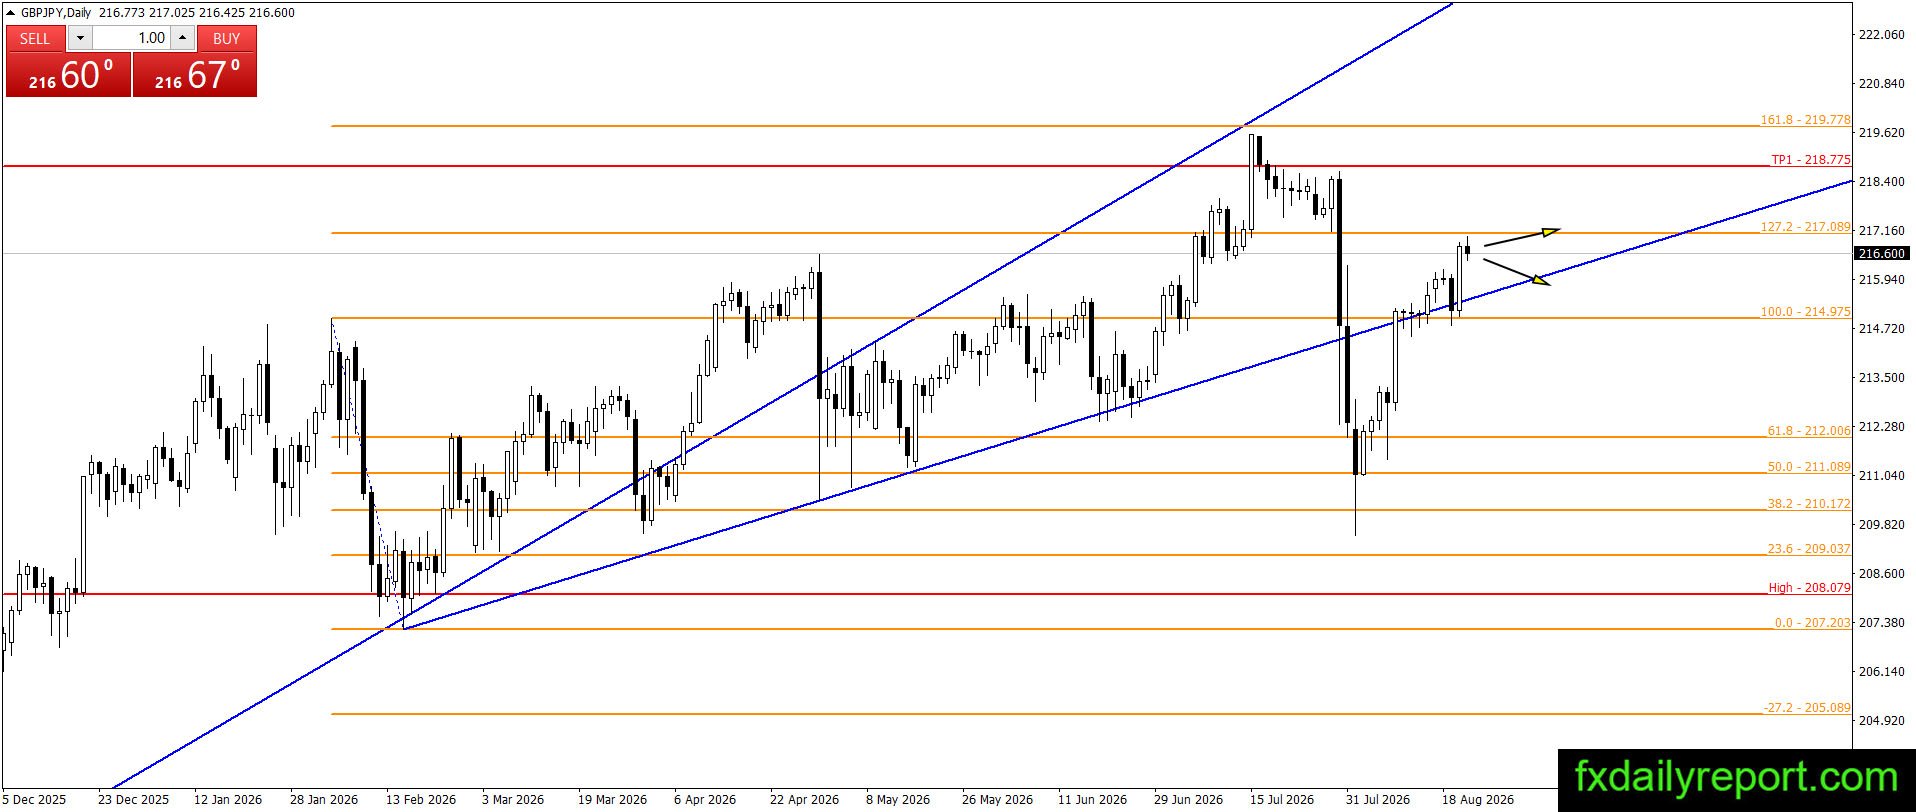
GBP/JPY invalidated its previous potential swing high as strong buying off the primary ascending trendline drove price action higher toward the 216.60 region, approaching the 127.2% Fibonacci extension at 217.09. The pair remains anchored by long-term ascending support, but upside momentum is stretching near key resistance levels. A confirmed bearish reversal or the formation of a fresh structural swing high is necessary to signal a trend shift before considering short exposure.
Today’s critical level to watch:
Support: 214.965, 211.50, 210.00
Resistance: 218.00
GBP/CHF
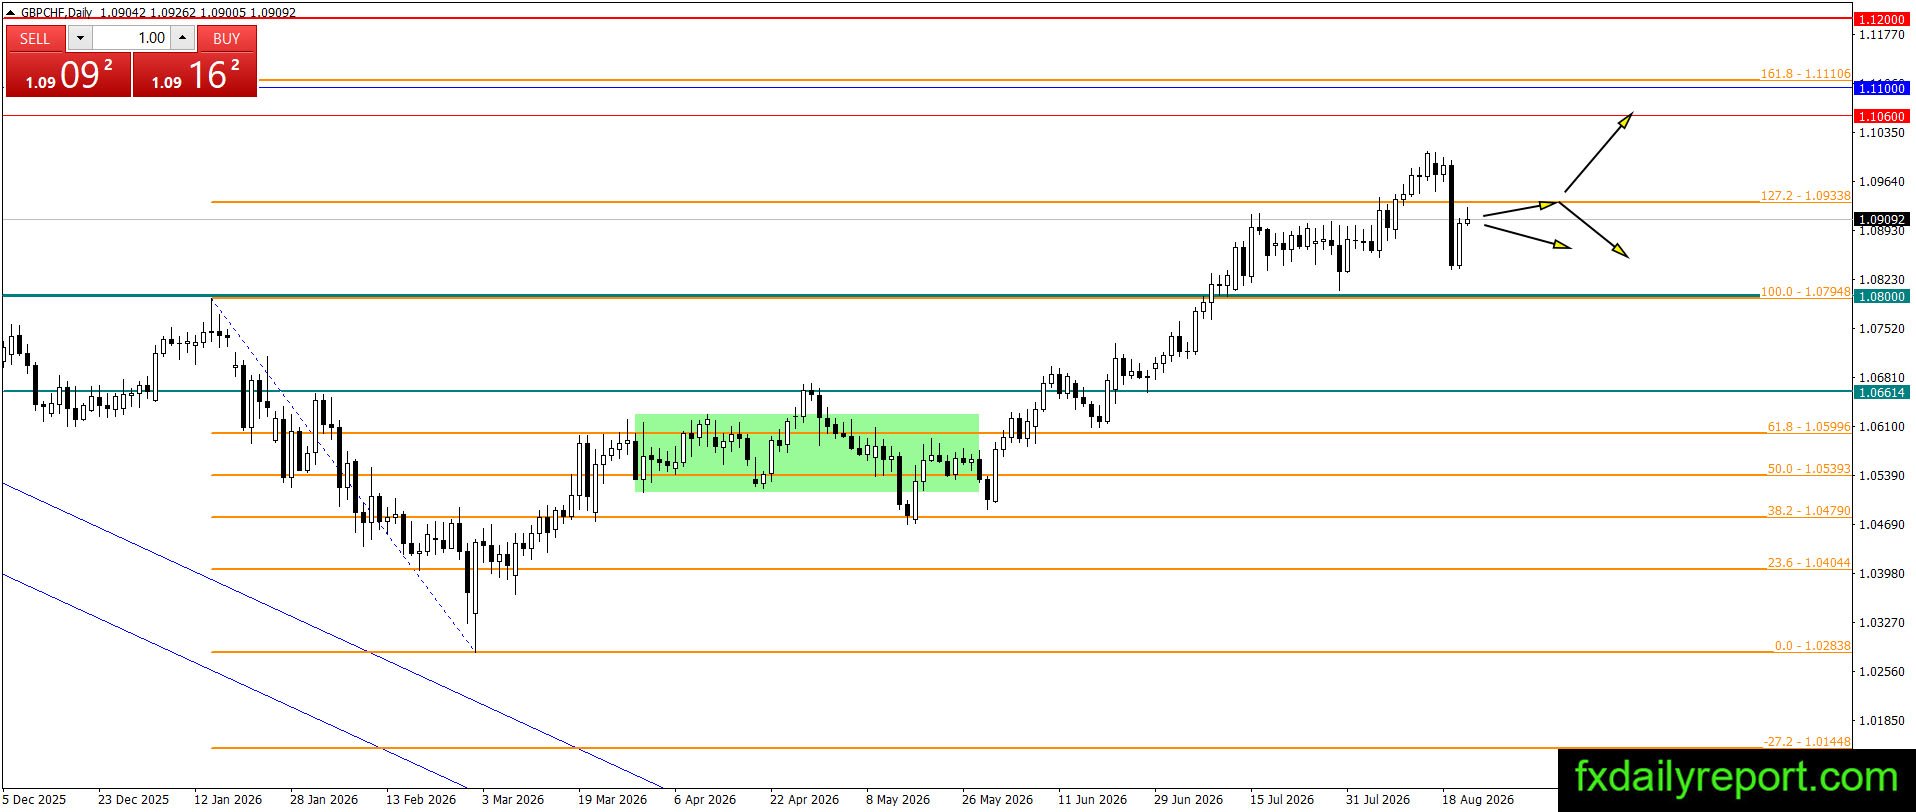
GBP/CHF produced a slight recovery around 1.0909 following a sharp, high-volume bearish candlestick. Although the broader structure remains tilted to the upside, the magnitude of the recent drop serves as a notable warning sign. Immediate resistance rests near 1.0934, while the primary structural line in the sand sits at the 1.0800 support zone based on the 100% Fibonacci level. Risk management should remain strict below 1.0800 in case the support level breaks down further.
Today’s critical levels to watch:
Support: 1.0800, 1.0660, 1.0600, 1.0500, 1.03599
Resistance: 1.0900, 1.1060, 1.1100