
Wall Street Recovers Intraday as Dip Buyers Step In Amid Geopolitical Tensions
U.S. equities are trading higher in Monday’s session after an earlier bout of volatility triggered by geopolitical tensions. The Dow Jones Industrial Average is up 84.55 points (+0.17%) at 49,062.47. The S&P 500 is gaining 21.86 points (+0.32%) to 6,900.74, while the Nasdaq Composite advances 131.069 points (+0.58%) to 22,799.28.
Markets initially faced selling pressure as investors reacted to escalating geopolitical developments. However, the decline was met with dip-buying interest, allowing major indexes to recover and move into positive territory during the session. Technology stocks are leading the rebound, supporting broader index stabilization. The S&P 500 is attempting to hold above the 6,900 area, a level that may act as short-term sentiment gauge. Meanwhile, the Dow is hovering near the 49,000 mark as traders assess whether the recovery has sufficient momentum to extend into the close.

Investors are closely monitoring whether this intraday rebound can sustain into the final hours of trading or if renewed selling pressure emerges. The closing price action will provide clearer signals regarding short-term market direction.
Dow Jones Industrial Average (INDU)
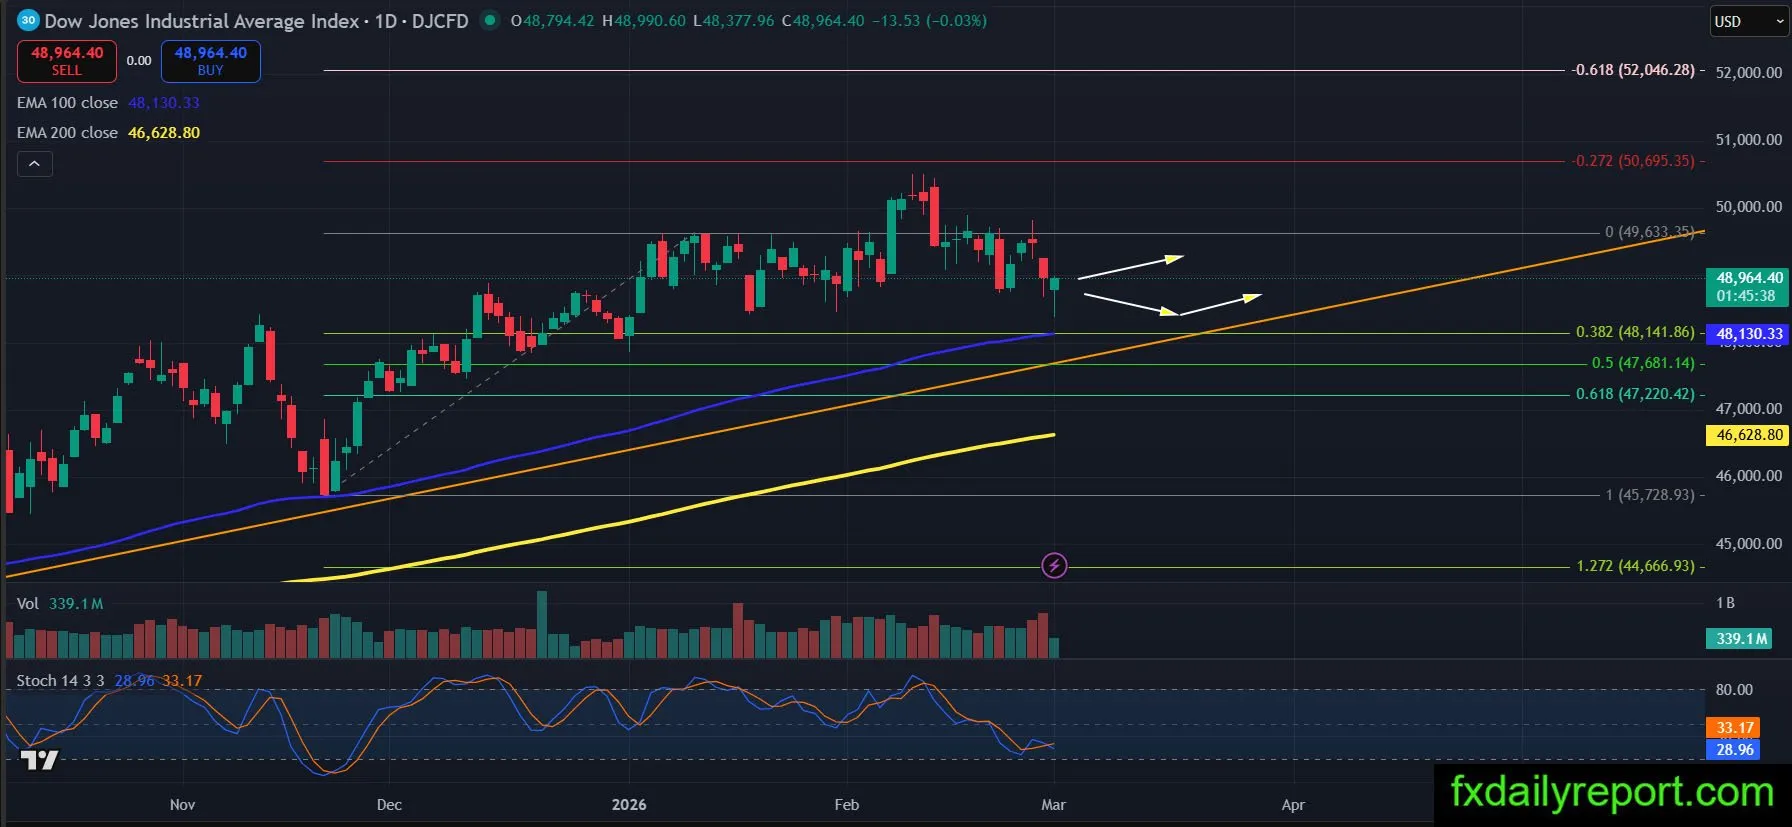
The DJIA swept below recent lows and showed a recovery during today’s session. Price reacted around the previous multiple-low area and is attempting to stabilize above that zone. If the index manages to close near the session high, the daily candle could form a pin bar pattern, signaling rejection of lower prices and opening room for upward movement. The broader structure remains constructive as long as price holds above the rising trend line. However, if another bearish attempt develops and price fails to sustain the recovery, continuation toward the trend line support could follow. For now, the reaction at prior lows suggests buyers are defending the area, but confirmation will depend on the daily close.
Lowes Companies, Inc (LOW)

LOW has printed a new lower swing low on the daily timeframe, indicating that the short-term structure has turned bearish. Price is currently trading near the EMA 100 levels and shows continued downside pressure. The next potential downside target is the purple demand zone around the $245.00–$255.00 area, where a technical bounce could develop. However, for a stronger bearish confirmation, a decisive daily close below $240.00 with strong momentum would be required. Without that confirmation, the current move may still be considered a corrective decline within a broader structure