
M Long-term outlook
Macy’s is the leading department store in the U.S. The company faced many challenges from the shift of consumer behavior from conventional shopping to online shopping. Declining sales, stores closures, laying-off all becoming the hot topic about Macy’s. However, biggest hit to the company is closure plan of its flagship store in 2017 located at Nicollet Mall.
The threat is more apparent especially when Amazon announce it is moving into apparel business. Without any improvement from Macy’s side, the analyst predicted Amazon would overtake Macy’s throne as biggest clothing seller by 2017.

Fortunately for Macy’s, November is a bullish month. Macy’s CEO, Terry Lundgren said the company position itself to cater the consumer needs through phone, most of them complete the purchase online, but many of them also looking to touch the physical product before purchase. The customer browse through the online websites or devices, come to the store, interacting with store representatives and make final purchase decision there.
The online experience looks positive for the company.
New Month
Monthly chart
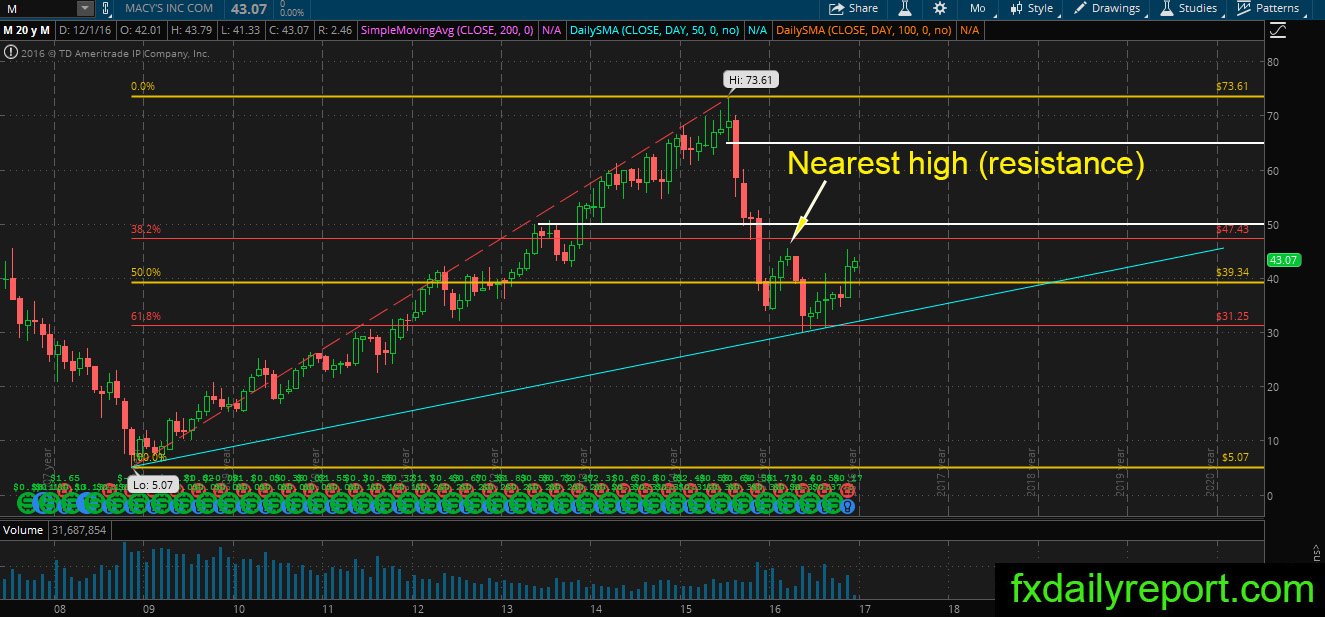
Sliding since August’15, Macy’s has yet to find its strong support. The price bounced in the middle of this year on June and moving near this year high printed on March’15 at $45.50. If it can move higher than the March’15 high, it will be greeted by the major resistance between $47 – $50.
At least if the price can reach the major resistance, means it prints higher high and indicates mid-term bullish reversal which might continue in 2017.
Weekly chart
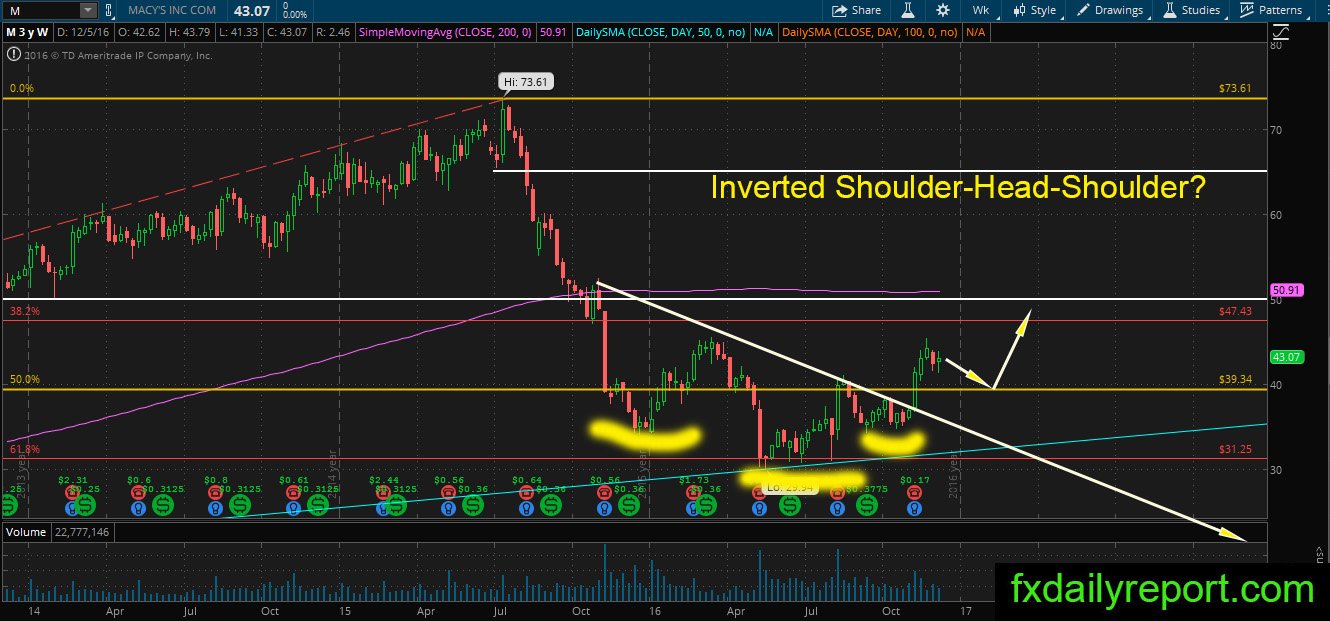
Optimistic outlook emerges in the weekly chart of M. The price might form inverted Shoulder-head-shoulder pattern which already broken 4-weeks ago. Similar to the monthly chart, another push higher than March’15 high will trigger more buying in M.
Daily chart
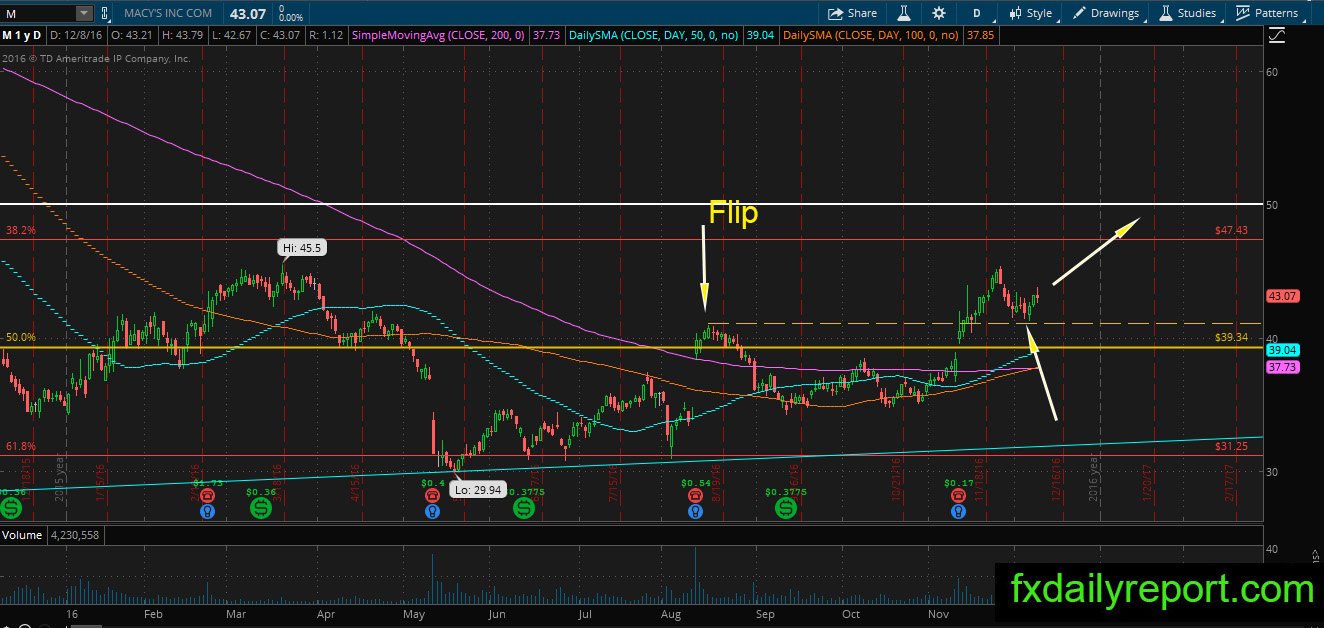
Bullish flip happened in the daily chart, and the price supported near $41.30. This is a bullish sign, and as long as price maintain its position above the flip level, it should move higher toward next resistance level.
Trade plan
Bullish position could be taken if price retraced maximum toward daily SMA 200 around $37.50. Lower than the level might turn the trend into bearish.
Bearish position observes if price reached $47-$50 major resistance. Look for the bearish pattern to enter the position.