
The USD/JPY currency pair on Friday pulled back off currency monthly highs of about 130.816 to trade at about 130.199. However, the currency pair bounced off the trendline support to surge above 130.530 late on.
The pair continues to trade within an ascending channel formation in the 60-min chart. It remains pinned above the 100-hour moving average line. However, Friday’s pullback prevented it from entering the overbought conditions of the 14-hour RSI.
USD/JPY Fundamentals Overview

From a fundamental perspective, the USD/JPY currency pair is trading at the back of a relatively busy period in the US market. On Friday, the US non-farm payrolls for April came in higher than expected with 428k new jobs created compared to the forecasted average of 391k. On the other hand, the unemployment rate remanded unchanged from March at 3.6%, missing a slightly lower estimate of 3.5%. Elsewhere, the average hourly wage growth posted a change of 0.3%, failing to match the consensus (MoM) estimate of 0.4%, while the annual growth rate was in line with expectations at 5.5%.
In Japan, the Tokyo Consumer Price Index for April outperformed the expected (YoY) change of 1.9% with a change of 2.5%. The Tokyo CPI ex-food and energy also returned a higher change than expected with 0.8% versus a consensus forecast of -0.5%, while the CPI ex-fresh food outperformed the expected growth rate of 1.8% with a slightly higher growth rate of 1.9%. The monetary base matched the forecast of 6.6% down from 7.7% in the previous month.
USD/JPY Technical Analysis (the 60-min Chart)
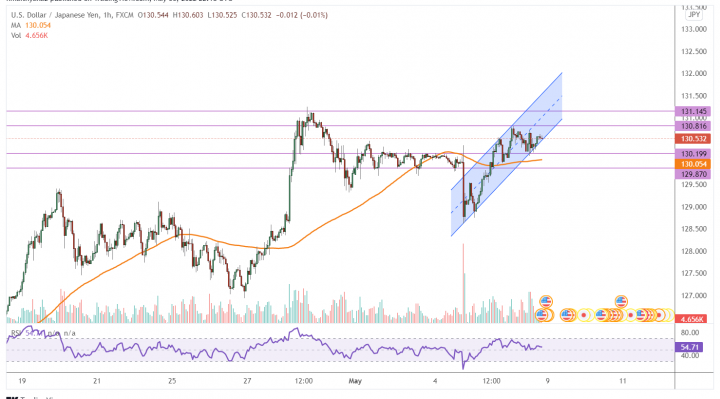
Technically, the USD/JPY currency pair seems to be trading within an ascending channel formation in the 60-min chart. This indicates a significant short-term bullish bias in the market sentiment.
Therefore, the bulls will be targeting short-term profits at about 130.816, or higher at 131.145. On the other hand, the bears will look to pounce o potential pullbacks at about 130.199, or lower at 129.870.
USD/JPY Technical Analysis (the Daily Chart)
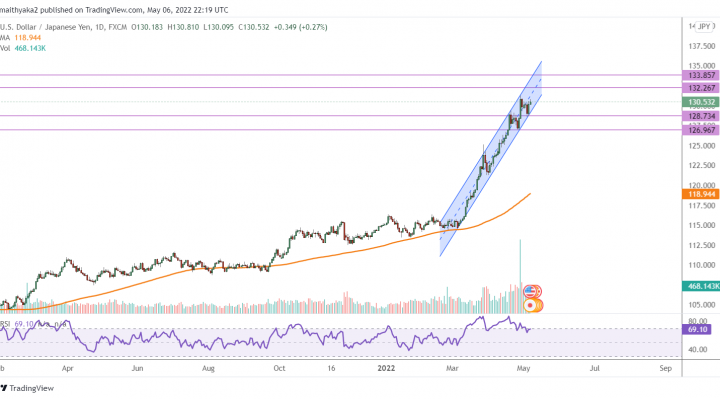
In the daily chart, the USD/JPY currency pair appears to be trading within a sharply ascending channel formation. This indicates a significant long-term bullish bias in the market sentiment.
Therefore, the bulls will be looking to retain long-term control of the currency pair by targeting profits at about 132.267, or higher at 133.857. On the other hand, the bears will target profits at about 128.734, or lower at 126.967.