
The Bitcoin price on Thursday fell off session highs of about $27,576 to trade at about $26,016 ahead of the US nonfarm payrolls. The BTC/USD appears to be trading within a descending channel formation in the 60-min chart.
The price of the pioneer cryptocurrency has now fallen to trade a few levels below the 100-hour moving average line. As a result, Bitcoin has descended into the oversold levels of the 14-hour RSI.
Bitcoin Price Fundamentals Overview

From a fundamental perspective, the price of the pioneer cryptocurrency is trading at the back of a relatively busy period in the market. On Friday, the US Securities and Exchange Commission again delayed making a decision on Valkyrie, WisdomTree and Invesco’s Spot Bitcoin ETF applications. The BTC/USD and other cryptocurrencies spiked in July when several leading asset managers expressed their support for crypto with applications to offer Spot Bitcoin ETFs to clients.
In the latest round of US data, the US core personal consumption expenditures price index for July matched the expected (MoM) change of 0.2%. The (YoY) equivalent was also in line with the estimated change of 4.2%. Elsewhere, personal spending beat 0.6% with a change of 0.8%, while personal income fell short of 0.3% with a change of 0.2%. The initial jobless claims for the week ending August 25 outperformed the expected claim count of 235k with a tally of 228k.
Bitcoin Price Technical Analysis (the 60-min Chart)
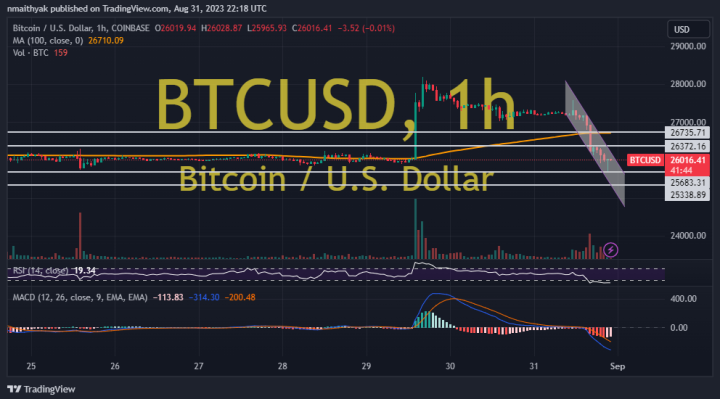
Technically, the BTC/USD seems to be trading within a descending channel formation in the 60-min chart. The hourly MACD also appears to have recently completed a downward crossover supporting a bearish sentiment.
Therefore, the bears will be looking to stretch the current run of declines toward $25,683 or lower to $25,338. On the other hand, the bulls will look to pounce on rebounds at about $26,372 or higher at $26,735.
Bitcoin Price Technical Analysis (the Daily Chart)
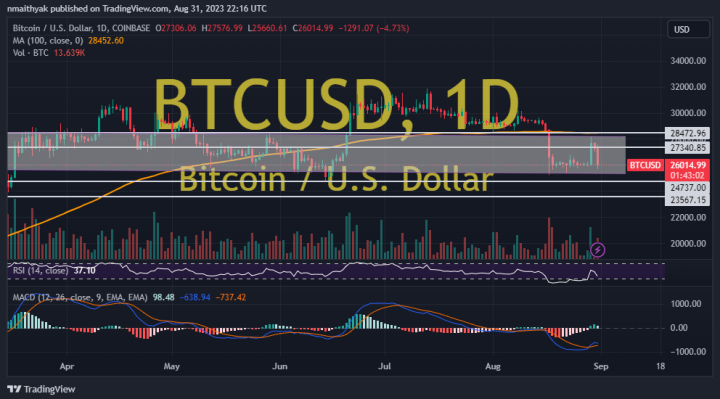
In the daily chart, Bitcoin appears to be trading within a sideways channel formation. However, the daily MACD appears to be attempting an upward crossover after a recent pullback.
Therefore, the bulls will be targeting rebound profits at about $27,340 or higher at $28,472. On the other hand, the bears will be targeting long-term profits at about $24,737 or lower at $23,567.