
KO Long-term outlook
Cherry coke is the headline for Coca-Cola this month as the company cleverly choose the right figure to use in marketing their Coke in China. Coca-Cola asks permission from Warren Buffett to print his figure on the bottle which is highly accepted by China consumer.
The company also respond promptly toward the changing consumer behavior to switch to a healthier choice. Recently, Coca-Cola acquires Ades from Unilever who produce soy drink with various fruit flavor. This acquisition shows how serious the company expands their portfolio in the new line of business, the non-soda beverages.

Despite the drop in brand ranking from 11 (2016) to 16, the company might start pumping up its value again once the new line of business established.
Click here to see KO March analysis
New Month
Monthly chart

Series of weakness in Coca-Cola shares stopped after the shares bounce from its long-term trendline where Fibonacci level present. This month, the price break above $43.09 which is the 38.2% retracement level and this is bullish. In coming months, KO expected to continue higher and possibly challenge its 12-month high at $47.13.
Weekly chart

Similar to the monthly chart, this week the price moving above the resistance level which confirms more upside. The close above Fibonacci retracement level 38.2% ($43.09) might be followed by a test first before further continuation, though it is not mandatory.
Daily chart
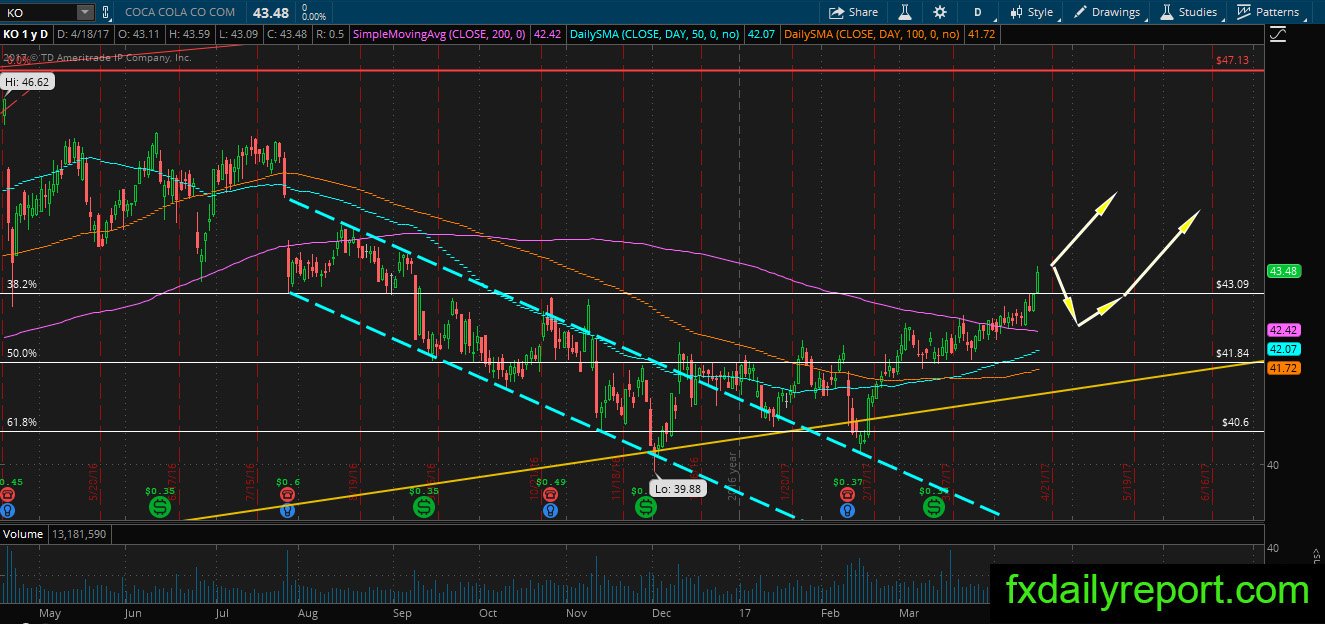
The daily chart of KO also shows promising outlook as the price broke above the daily SMA 200. The price expected to continue moving upward with or without the test of averages.
Trade plan
A long position needs to wait for a test of daily SMA 200 or the Fibonacci retracement 38.2% level.
A short position needs to wait until strong bearish pattern formed. The formation expected near the 12-month high.