
The bitcoin price on Friday bounced off the trendline support at about $39,808 to trade at about $40,269 after the latest round of data. The BTC/USD continues to trade within a sideways channel formation in the 60-minute chart.
Bitcoin has now advanced to trade above the 100-hour moving average line. As a result, the price of the world’s most popular cryptocurrency is moving closer to the overbought levels of the 14-hour RSI.
Bitcoin Price Fundamentals Overview

From a fundamental perspective, the BTC/USD is trading at the back of a relatively busy period in the US market. On Friday, the US personal consumption expenditures price index for December matched the (MoM) and (YoY) expectations of 0.2% and 2.6%, respectively.
The core personal consumption expenditures price index for the period missed the forecasted (YoY) change of 3% with a change of 2.9%, while the (MoM) equivalent was in line with the estimate of 0.2%. Personal income for December matched the (MoM) forecast of 0.3%, while personal spending beat the expectation of 0.4% with a change of 0.7%. Pending home sales also missed the expected change of 1.5% with a change of 8.3%.
On Thursday, the US initial jobless claims for last week missed the estimate of 200k with a tally of 214k. The durable goods orders for December also fell short of the expected change of 1.1% with a change of 0%, while the durable goods orders ex-transportation beat 0.2% with a change of 0.6%. On the other hand, the durable goods orders ex-defence missed the forecasted change of 1.1% with a change of 0.5%.
Bitcoin Price Technical Analysis (the 60-min Chart)
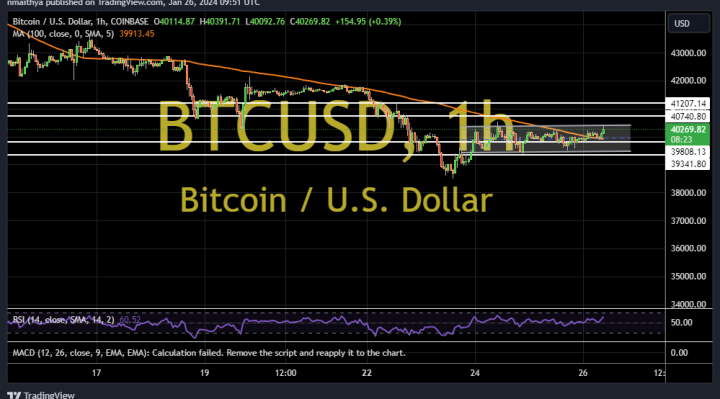
Technically, the BTC/USD appears to be trading within a sideways channel formation in the 60-minute chart. The 14-hour RSI has recently bounced back to move closer to overbought conditions.
Therefore, the bulls will be looking to stretch the current rebound towards $40,740 or higher to $41,207. On the other hand, the bears will look to pounce on pullbacks at about $39,808 or lower at $39,341.
Bitcoin Price Technical Analysis (the Daily Chart)
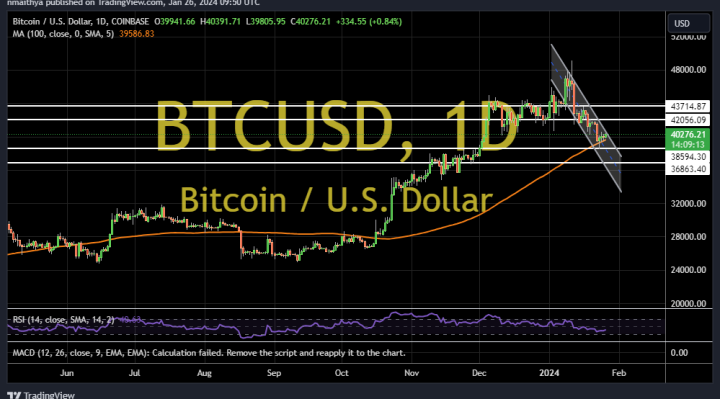
In the daily chart, the price of the pioneer cryptocurrency appears to be trading within a descending channel formation. The 14-day RSI also seems to support a long-term bearish bias as it edges closer to oversold conditions.
Therefore, the bears will be looking to extend the current declines towards $38,594 or lower to $36,863. On the other hand, the bulls will look to pounce for profits at about $42,056 or higher at $43,714.