
On Thursday, the Bitcoin price pulled back off the session highs of about $91,550 to trade below $88,000, before bouncing back to $89,469. The BTC/USD trades within an ascending channel formation in the 60-minute chart.
The price of the pioneer cryptocurrency continues to trade a few levels above the 100-hour moving average line. As a result, Bitcoin still seems to have room left to run before reaching the overbought levels of the 14-hour RSI.
Bitcoin Price Fundamentals Overview

From a fundamental perspective, the BTC/USD trades during a relatively busy period in the U.S. market. The crypto industry still rides the tailwinds of Trump’s huge election win, with the community optimistic a Trump-driven crypto deregulation policy could pave the way for innovative building for the industry in the U.S.
There is already speculation that SEC chair Gary Gensler will step down before January, and Trump has reportedly chosen a crypto-advocate to be the attorney general in his administration.
In the latest U.S. economic data, the initial jobless claims for the week ending November 8 fell to 217k, down from 221k in the preceding week, beating the forecasted tally of 223k. The producer price index for October also outshone the (YoY) expectation of 2.3% with a change of 2.4%, up from 1.9% in September. The (MoM) equivalent was in line with the estimate of 0.2%, up from 0.1%.
The producer price index ex-food and energy exceeded the forecast of 3% with 3.1%, up from 2.9%, while the (MoM) forecast matched 0.3%, up from 0.2%. Traders will be looking forward to Friday’s U.S. retail sales data for October.
Bitcoin Price Technical Analysis (the 60-min Chart)
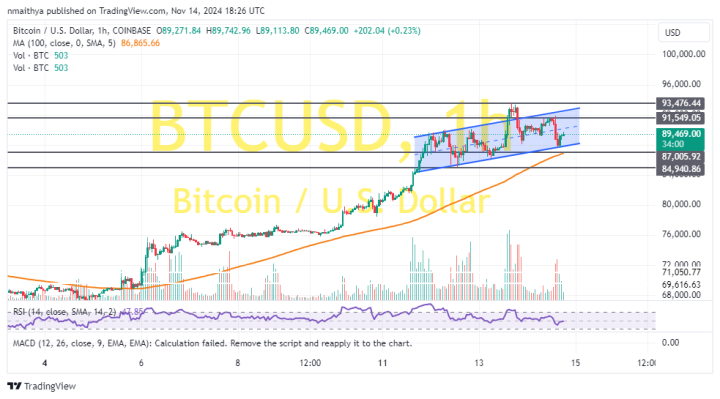
Technically, the BTC/USD trades within an ascending channel formation in the 60-minute chart. However, the 14-hour RSI has recently pulled back to avoid rallying into overbought conditions.
Therefore, the bears will look to extend the current pullback towards $87,005 or lower to $84,940. On the other hand, the bulls will look to pounce on profits at about $91,549 or higher at $93,476.
Bitcoin Price Technical Analysis (the Daily Chart)
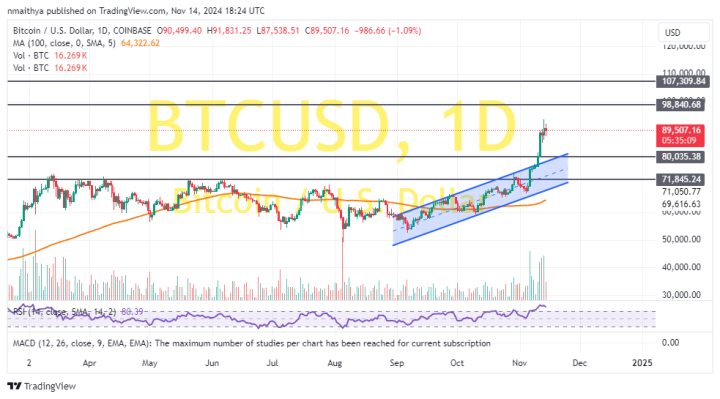
In the daily chart, the BTC/USD has completed an upward breakout from an ascending channel formation. The 14-day RSI has also rocketed into the overbought conditions of the indicator.
Therefore, the bulls will be targeting long-term profits at about $98,840 or higher at $107,309. On the other hand, the bears will look to pounce on pullbacks at about $80,005 or lower at $71,845.