
On Friday, the bitcoin price bounced off the session lows of about $92,379 to trade at about $97,236 after the latest U.S. Data. The BTC/USD continues to trade within a descending channel formation in the 60-minute chart.
The price of the pioneer cryptocurrency also remains a few levels below the 100-hour moving average line. However, Friday’s rebound prevented Bitcoin from falling into the oversold levels of the 14-hour RSI.
Bitcoin Price Fundamentals Overview

From a fundamental perspective, the BTC/USD trades during a relatively busy period in the U.S. market. On Friday, the U.S. personal consumption expenditures – price index for November missed the (MoM) expectation of 0.2% with a change of 0.1%. The (YoY) equivalent also fell short of 2.5% with a change of 2.4%.
The core personal consumption expenditures – price index for the period also failed to match the (MoM) and (YoY) forecasts of 0.2% and 2.9%, respectively with rates of 0.1% and 2.8%. On the other hand, personal income for the month missed 0.4% with 0.3%, while personal spending fell short of 0.5% with 0.4%.
The Michigan Consumer Sentiment Index for December remained steady at 74 in line with estimates, while the UoM 5-year consumer inflation expectation for the period fell to 3%, down from 3.1% in November, missing the forecast of 3.1%.
On Thursday, the annualised U.S. gross domestic product for Q3 beat the expected change of 2.8% with a change of 3.1%, while the gross domestic product – price index was in line with the estimate of 1.9%. Elsewhere, the initial jobless claims for last week beat the forecast of 230k with a claim count of 220k, down from 242k in the preceding week.
Bitcoin Price Technical Analysis (the 60-min Chart)
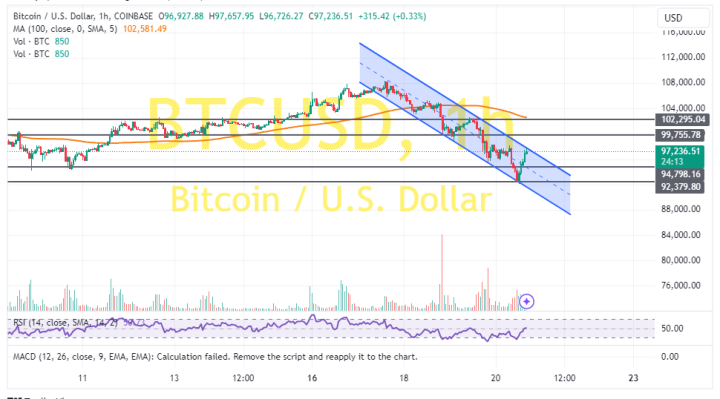
Technically, the BTC/USD trades within a descending channel formation in the 60-minute chart. However, the 14-hour RSI has recently bounced back to avoid falling into oversold conditions.
Therefore, the bulls will look to extend the current rebound towards $99,755 or higher to $102,295. On the other hand, the bears will look to stretch the current run of declines toward $94,798 or lower to $92,379.
Bitcoin Price Technical Analysis (the Daily Chart)
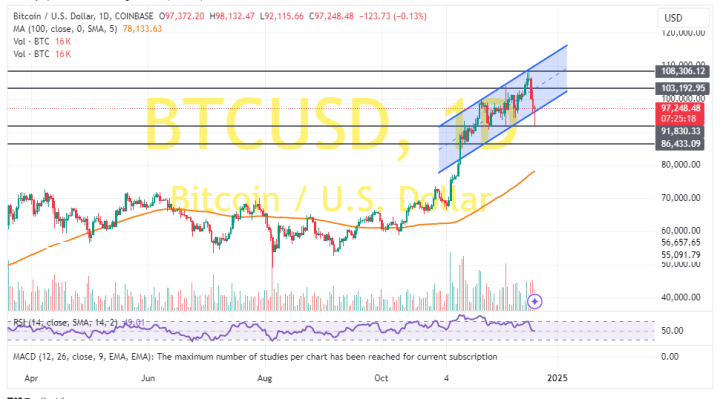
In the daily chart, the BTC/USD trades within an ascending channel formation. However, the 14-day RSI has recently pulled back to avoid rallying into overbought conditions.
Therefore, the bears will look to extend the current pullback towards $91,830 or lower to $86,433. On the other hand, the bulls will look to ride the current rally towards $103,192 or higher to $108,306.