
Silver long-term technical analysis
June is another bearish month for silver after the price closed at $16.55, lower than $17.28 May close. The price continues further lower as low as $14.62 and creates hopeless situation for the bull. Fortunately, in the middle of July, silver found support and start a bounce upward. The price currently sits at $16.45 or near the previous month close.
A Recent development from fundamental show current increase in silver dominated by a shift in central banks sentiment and some political shakeout in U.S. President Donald Trump failed to deliver the health care overhaul and currently under investigation over possible help from Russia in his presidential campaign.

Another factor in play also the weakness of U.S dollar. Though the market knows President Trump love to have U.S dollar weaken, it is overplayed, and the index keeps moving lower to print new yearly low. Analysts at J.P Morgan start to feel the dollar almost reach the bottom and could start a rally in the second-half of 2017. Outlook still the same overall, as long as other Central Banks building optimism, it looks like silver will enjoy more upside.
Click here to see previous Silver long-term technical analysis June 2017
Monthly chart
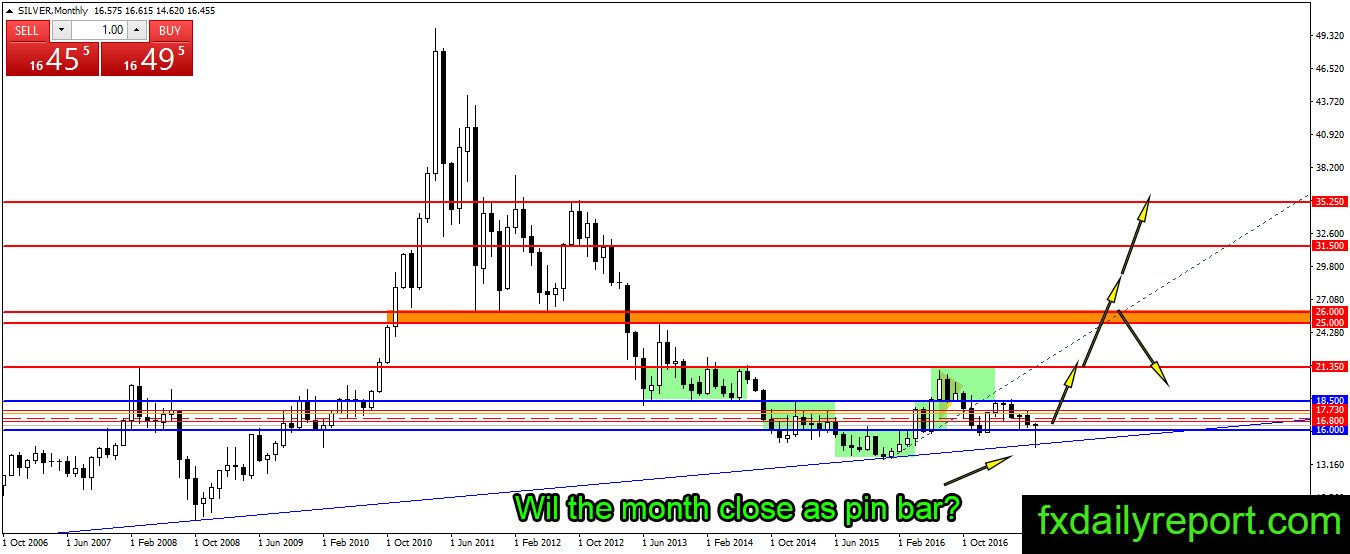
There is an interesting development on the monthly chart of silver. Is it a coincidence the price of silver moves down and found support near at the trendline? July nearly come to an end, and the price currently back near opening price and might close as bullish pin bar. The close as bullish pin bar is extremely positive for silver forward trend.
If the price closed as pin bar, the bull only needs to push the price above July high in August to drive upward momentum in silver. We favor the price reach $21.35 by the end of the year and possibly $25 for long-term. (All will depend on U.S dollar bounce).
Weekly chart
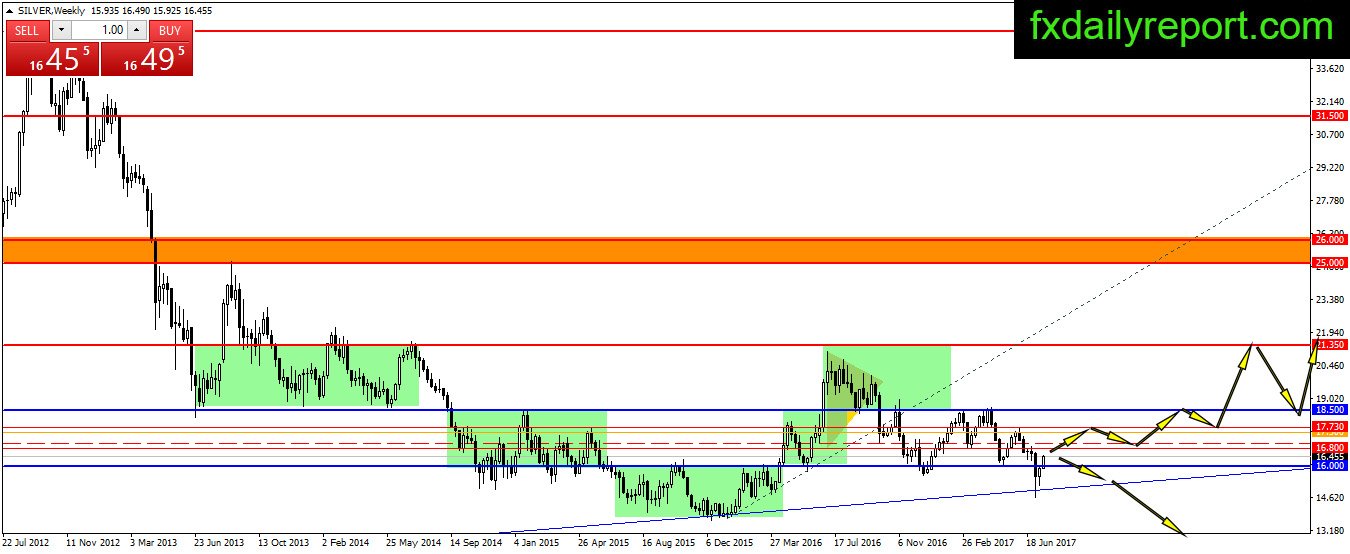
There is no need for a complicated analysis silver break below $16.00 handle and closed below it for two weeks. The bull return into the market and bring the silver price closed above $16.00 in the third week thus invalidated the breakout below $16.00. This situation creates a “Bear trap” pattern and further movement above previous week high will trigger sharp buying.
Daily chart
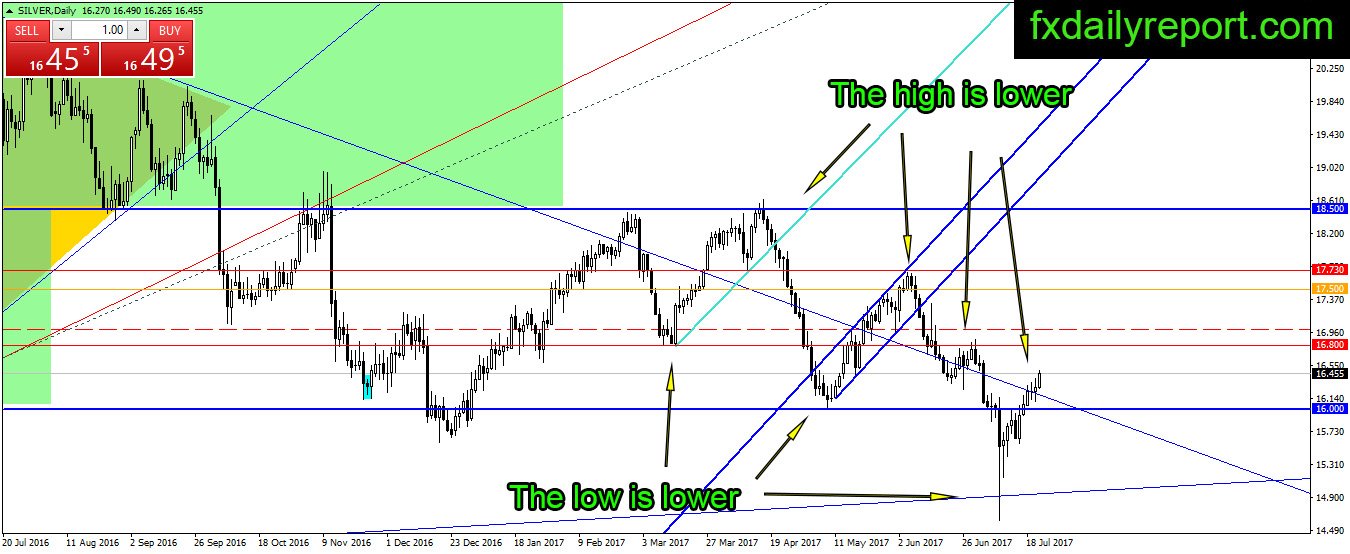
Although there is a bullish indication on the monthly and weekly chart, it is too early for the bull to celebrate. Silver on the daily chart has not made higher high yet. We could see the high and low gets lower which tell the trend to stay bearish. The bull needs to clear $17.00 before traders start to shift their outlook into bullish.
Trade plan
Bullish: Wait until the breakout above $17.00 and successful re-test.
Bearish: Short position could be taken from $16.80 – $17.00 area with a tight stop order. A breakout above this area might lead the bear to wait at $18.50.