
Natural gas is holding steady inside its ascending channel, with price bouncing off the channel bottom near $2.900 and climbing back up to test the $2.940 mark.
This bounce suggests that the longer-term uptrend remains intact, as buyers continue to defend the rising trend line that has been in place since mid-August.

Looking at the Fibonacci extension levels drawn from the $2.831 swing low to the $3.077 swing high, price is currently hovering just above the 38.2% level at $2.925, which appears to be holding as a floor for the recovery.
If this level continues to hold, natural gas could push higher toward the 50% Fib at $2.954, followed by the 61.8% level at $2.983. A break above these zones could open the door to the 76.4% Fib at $3.019 and eventually a retest of the $3.077 swing high, which would complete the full extension and pave the way for the ascending triangle-like pattern near the highs to resolve to the upside.
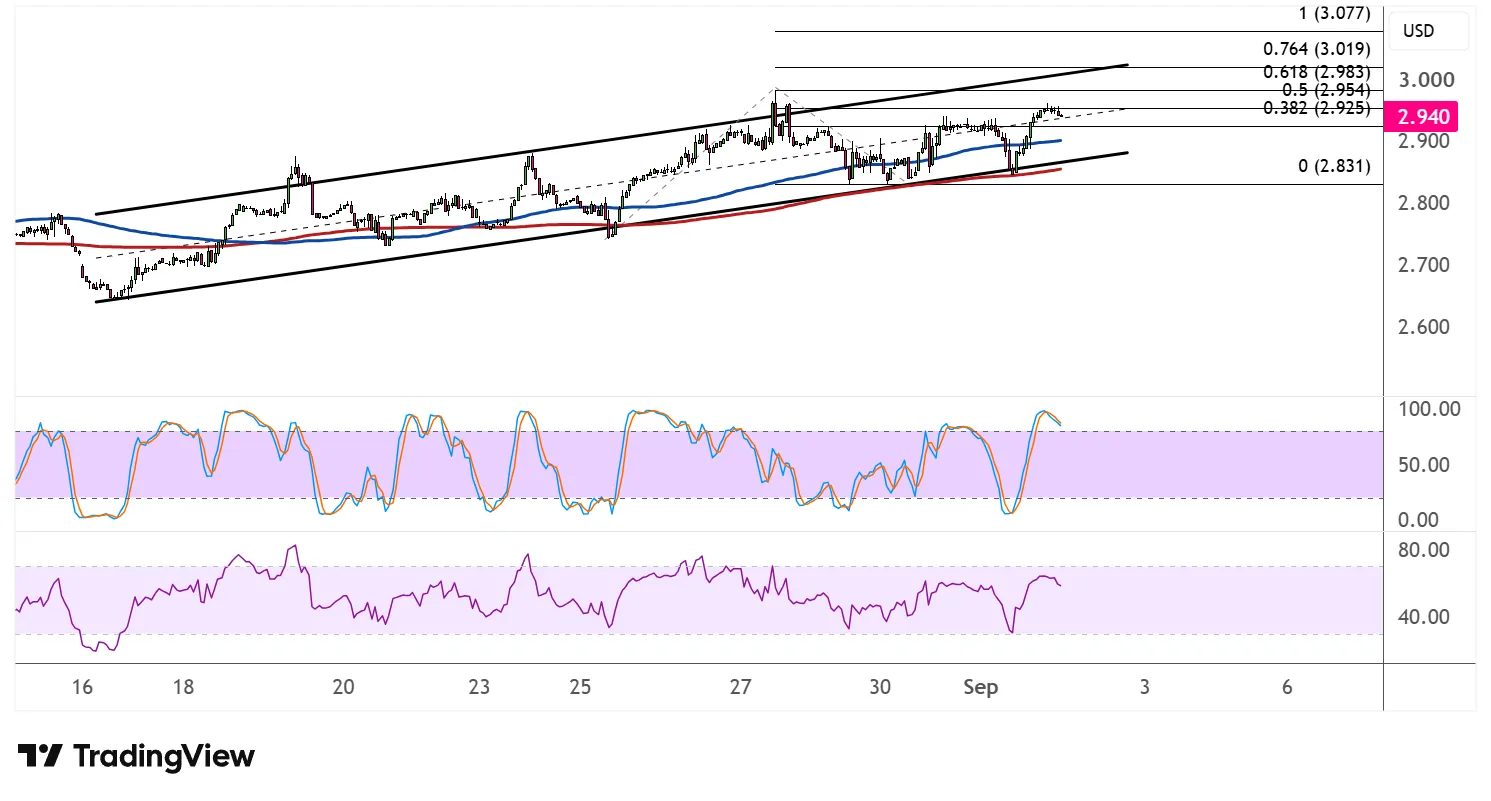
On the moving average front, the 100 SMA remains above the 200 SMA, confirming that the path of least resistance is still tilted to the upside. Price is also trading above both moving averages, which could continue to serve as dynamic support on any pullbacks.
Stochastic recently dipped into oversold territory before curling higher, reflecting a return of bullish momentum after sellers ran out of steam. RSI is following a similar path, moving up from the midpoint after a brief dip, suggesting that buyers still have room to push prices higher before overbought conditions set in.
As long as the ascending channel support and the 38.2% Fib retracement hold, natural gas looks poised to resume its climb toward the upper Fibonacci extension levels. A break below the channel bottom or the 38.2% Fib, however, could invite a deeper correction back toward the $2.900 handle or lower, delaying the next leg higher.