
WTI crude oil has carved out a steep rally since late August, climbing from lows near $80.18 to a recent high of $93.05 before easing off to trade around $91.67.
A new ascending trend line has formed along the swing lows of this latest leg higher, and price is currently testing this trend line after slipping from the peak.

If this newly formed support holds, WTI could resume its climb back toward the $93.05 area of interest or higher. The Fibonacci retracement tool, drawn from the $80.18 low to the $93.05 high, highlights where dip buyers could step in should the pullback deepen.
The 38.2% Fib lines up at $88.13, close to where the trend line intersects, while the 50% level sits at $86.62. A larger correction could stretch to the 61.8% Fib at $85.10, which would still keep the broader uptrend intact as long as buyers defend this zone.
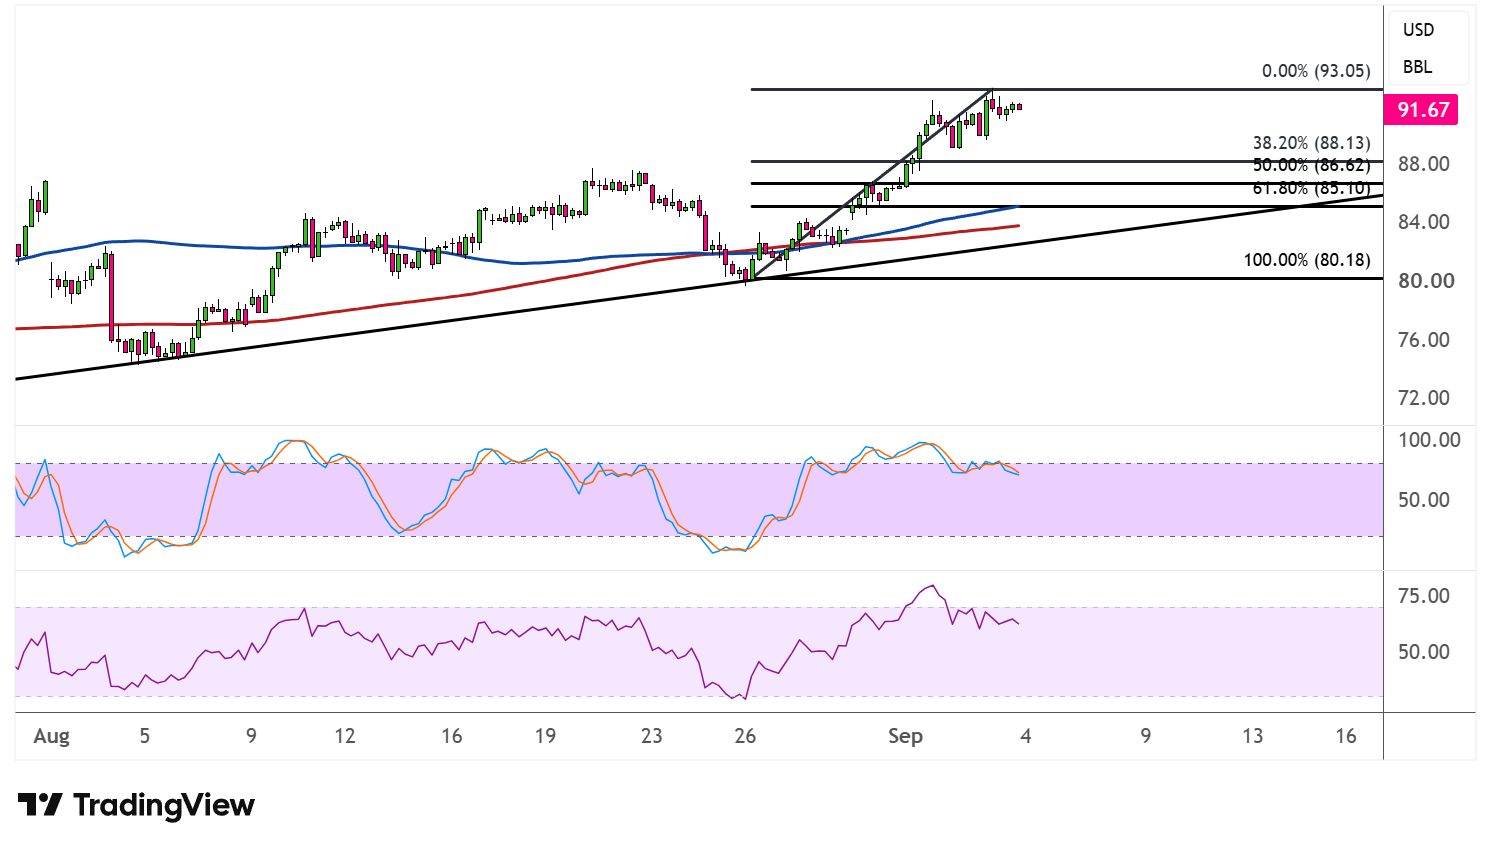
The 100 SMA remains above the 200 SMA, confirming that the path of least resistance stays tilted to the upside, even though price has pulled back closer to both moving averages after extending well above them during the rally. A bounce from current levels or the Fib zones could reinforce this dynamic support.
Stochastic has turned lower from the overbought region, reflecting some fading bullish momentum, and still has room to fall before reaching oversold territory, which suggests the correction could persist a bit longer. RSI has also eased back from its recent highs but remains above the midline, indicating that buyers still have a slight edge for now.
Traders may want to watch upcoming inventory data and any fresh geopolitical headlines, as these could determine whether the new trend line support holds or gives way to a deeper slide toward the lower Fibonacci levels.
Geopolitical headlines continue to influence oil prices, with rumors of potential de-escalation keeping a lid on rallies after a WSJ report suggested Trump was open to the idea of declaring the Iran war over.