
Natural gas has been climbing steadily inside an ascending channel since late August, but the rally may be running out of steam after a topping pattern took shape near the $3.000 handle.
Price carved out a head and shoulders formation, with the head marking the recent swing high and the right shoulder forming just above $2.960 before rolling over. The neckline of this pattern happens to coincide with the ascending channel’s lower boundary, currently being tested near the $2.900 to $2.920 area.

A confirmed break below this shared support and neckline zone could validate the reversal pattern, opening the door for a slide of the same height as the formation, potentially dragging price back toward the $2.750 to $2.800 region where the channel first took shape.
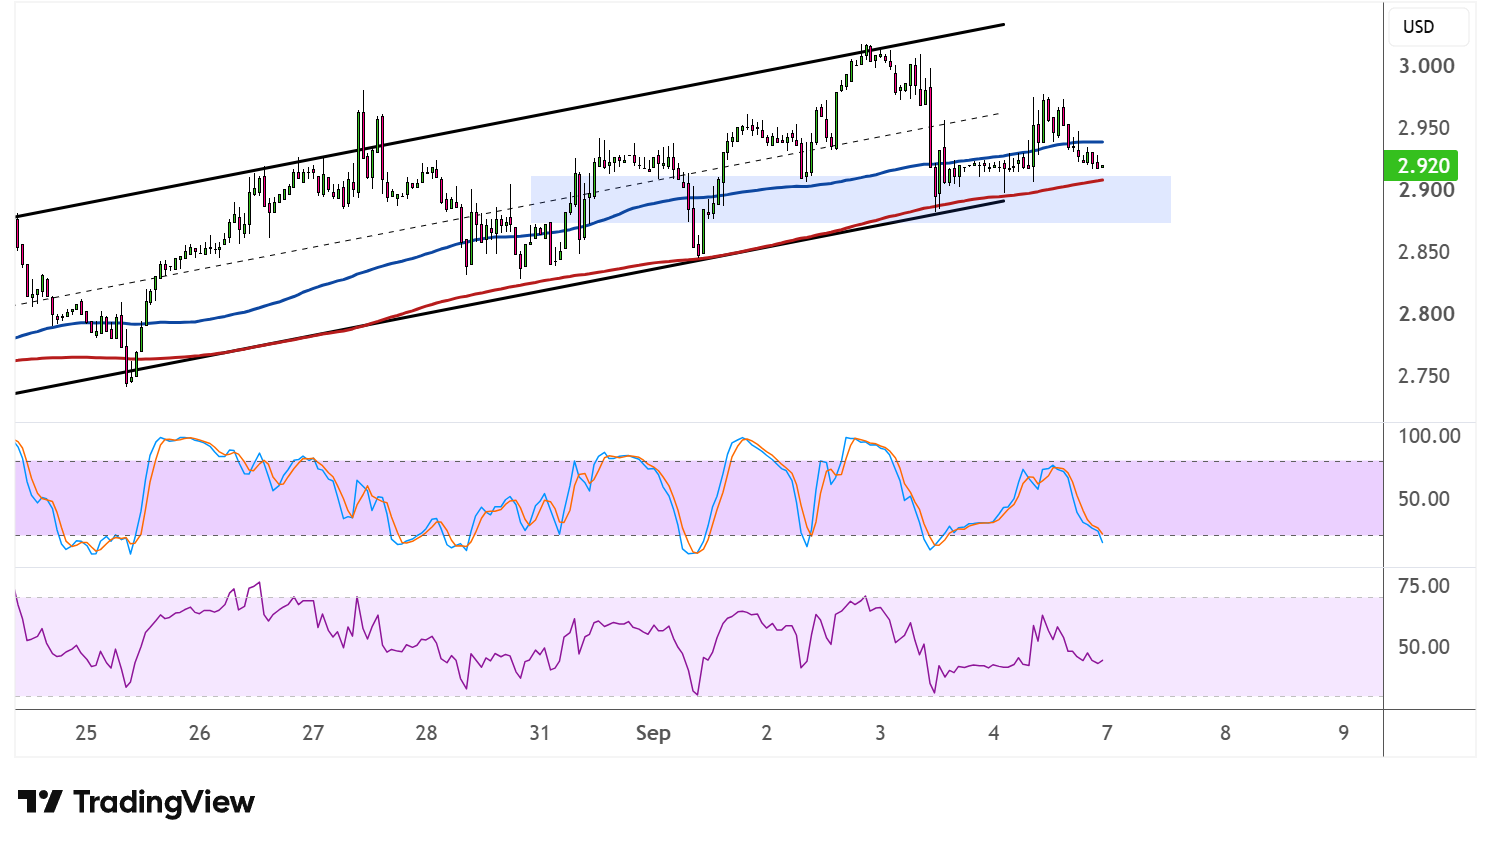
The 100 SMA is still above the 200 SMA, keeping the longer-term uptrend technically intact, but price is now dipping toward the faster moving average, and a decisive break of both could shift the path of least resistance to the downside.
Stochastic is heading south from overbought territory and still has plenty of room before reaching oversold, suggesting the correction could have further to run. RSI is also turning lower with room to fall before hitting oversold levels, reinforcing the idea that sellers may keep the upper hand in the near term.
Traders will likely keep an eye on weekly inventory data and shifting weather forecasts, as either could tip the balance between a neckline breakdown or a bounce back toward the highs. In addition, escalating Middle East geopolitical tensions could also keep supply concerns in play and support energy prices.
Meanwhile, the dollar faces another test as the CPI report looms on Friday while Fed officials are in a blackout period ahead of their September decision. Stronger than expected figures could cement hopes for a hike, while another miss could push back tightening odds.