
GBPCAD recently broke down from its descending triangle formation, as price slipped below the pattern’s flat support near the 1.8602 mark before bouncing back up to retest this broken floor turned potential resistance.
The Fibonacci retracement tool shows where sellers could be waiting to jump back in. The 38.2% level is at 1.8722, while the 50% Fib is at 1.8759, closer to the 100 SMA dynamic resistance.

A larger bounce could reach the 61.8% level at 1.8795, which lines up near the triangle’s broken support and could be the line in the sand for a bearish retest.
If any of these Fibs hold as a ceiling, GBPCAD could resume its slide toward the swing low near 1.8602 or lower. A break above the Fibs, on the other hand, could open the door to a retest of the 100% level at 1.8915 or higher.
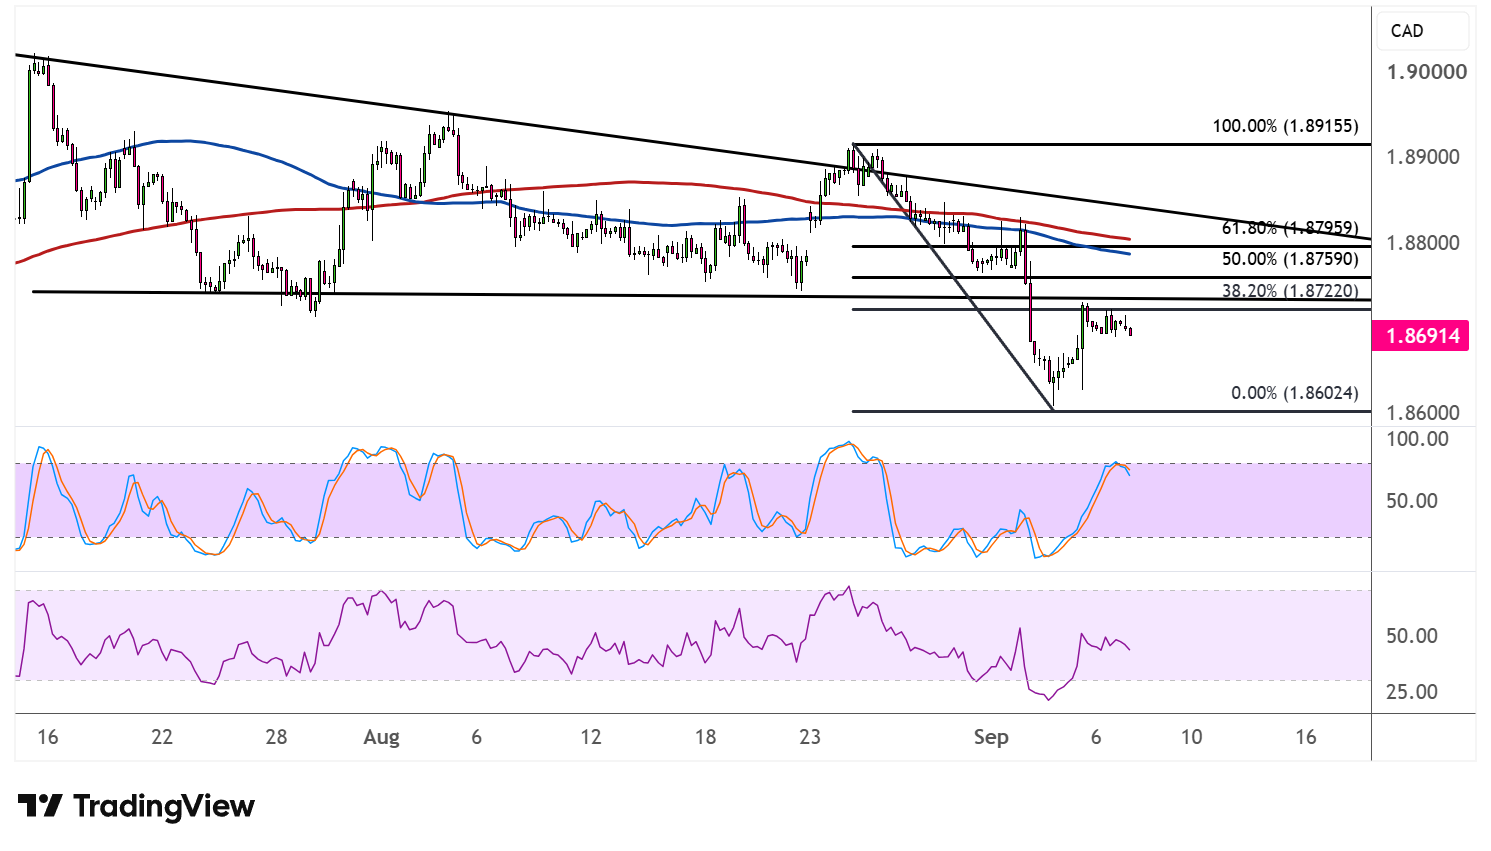
The 100 SMA remains above the 200 SMA to confirm that the path of least resistance is still to the downside, or that the selloff is more likely to resume than reverse. Price is currently attempting to climb back above both moving averages, so a rejection there could keep the broader downtrend intact.
Stochastic has climbed sharply out of the oversold zone, reflecting a strong return in bullish momentum during the bounce. The oscillator is now nearing overbought territory, though, which could mean buyers are running out of steam and a pullback might be in the cards.
RSI is also on the move higher, approaching the midline after spending time in oversold conditions. Still, the oscillator has room to climb before reaching overbought levels, so a bit more upside could unfold before sellers regain full control.
GBPCAD’s next move likely hinges on whether the Fibonacci retracement levels and the broken triangle support can cap the current bounce, as a rejection here would reinforce the bearish bias following the breakdown.