
On Thursday, the GBP/USD currency pair pulled back from the session highs of about 1.3557 to trade at about 1.3535. The currency pair trades within an ascending channel formation on the 60-minute chart.
The pair also fell to trade slightly below the 100-hour moving average line. However, the currency pair still has some room left to run before reaching the oversold levels of the 14-hour RSI.
GBP/USD Fundamentals Overview

From a fundamental perspective, the GBP/USD currency pair trades during a relatively busy period in both markets. In the UK, the BRC Like-for-Like sales for August missed the (YoY) expectation of 1.2%, with a change of 0.5%. Traders will be waiting for the UK gross domestic product data for July, the manufacturing production and industrial production for the month on Friday.
In the US, the initial jobless claims for last week fell slightly to 206k, down from the previous week’s equivalent of 207k, missing the forecasted claim count of 205k. On the other hand, the producer price index for August outperformed the expected (YoY) change of 5.3%, with a change of 5.4%, while the (MoM) equivalent was in line with the estimate of 0.4%.
The producer price index ex-food and energy for the period fell short of the forecasted (MoM) change of 0.3%, with a change of 0.2%. The (YoY) equivalent matched the forecast of 4.6%.
Looking forward, traders will be waiting for the US consumer price index data for August alongside the preliminary Michigan Consumer Sentiment Index for September and the August monthly budget statement on Friday.
GBP/USD Technical Analysis (the 60-min Chart)
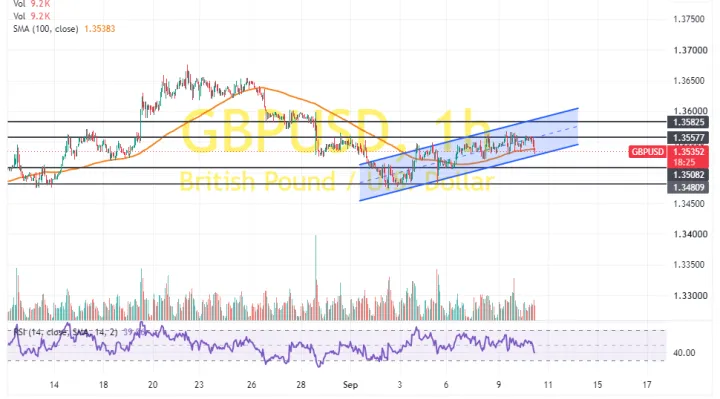
Technically, the GBP/USD currency pair trades within an ascending channel formation on the 60-minute chart. However, the 14-hour RSI has recently pulled back to move closer to oversold conditions.
Therefore, the bears will look to pounce on extended pullbacks at about 1.3508 or lower, down to 1.3481. On the other hand, the bulls will look to pounce on profits at about 1.3557 or higher, up to 1.3582.
GBP/USD Technical Analysis (the Daily Chart)
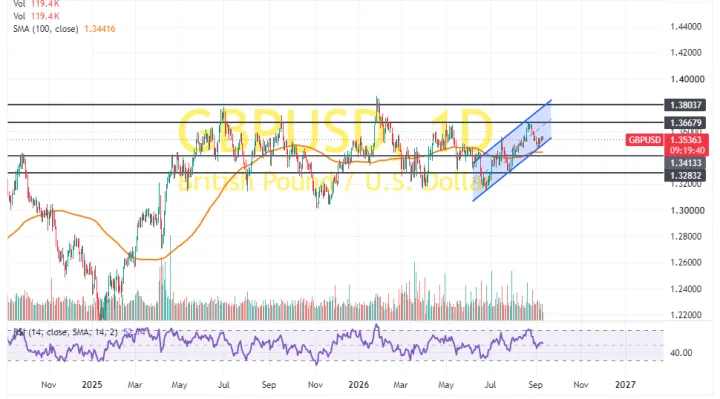
In the daily chart, the GBP/USD currency pair also trades within an ascending channel formation. However, the 14-day RSI has recently pulled back to avoid rallying into overbought conditions.
Therefore, the bears will look to ride the current run of pullbacks at about 1.3413 or lower, down to 1.3283. On the other hand, the bulls will look to pounce on profits at about 1.3668 or higher, up to 1.3803.