
On Thursday, the GBP/USD currency pair pulled back from session highs near 1.3407 to trade around 1.3352. The currency pair trades within a descending channel formation on the 60-minute chart.
After the pullback, the pair continues to trade several levels below the 100-hour moving average. As a result, the currency pair is on the verge of re-entering the oversold levels of the 14-hour RSI.
GBP/USD Fundamentals Overview

From a fundamental perspective, the GBP/USD currency pair trades during a relatively busy period in both markets. On Thursday, the Bank of England kept the base interest rate unchanged at 3.75% as expected. Earlier in the week, the UK retail price index for August fell short of the forecast (YoY) change of 3.5%, with a change of 3.4%.
On the other hand, the non-seasonally adjusted producer price index – output for the month outshone both the (MoM) and (YoY) forecasts of 0.3% and 3.3%, respectively, with 0.7% and 3.7%. Elsewhere, the consumer price index for the period matched both the (MoM) and (YoY) forecasts at 0.5% and 3.1%, respectively. The core consumer price index for the month was also in line with the (YoY) expectation of 2.6%.
In the US, building permits for August missed the expected (MoM) change of 1.41 million, with a tally of 1.394 million. Housing starts for the month also fell short of the forecast (MoM) change of 1.31 million, with 1.275 million. On the other hand, the initial jobless claims for last week fell to 196k, down from the previous week’s equivalent of 206k, beating the forecast claim count of 208k.
On the other hand, the Philadelphia Fed Manufacturing Survey for September fell to 37.8, down from 47.4, beating the forecast reading of 30.5. The pending home sales for August missed the (MoM) forecast of 2%, with a change of 0.3%.
GBP/USD Technical Analysis (the 60-min Chart)
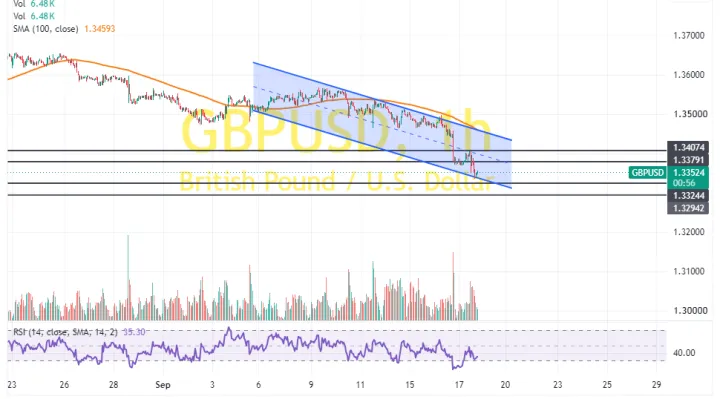
Technically, the GBP/USD currency pair trades within a descending channel formation on the 60-minute chart. The 14-hour RSI also supports a bearish bias as it edges closer to oversold conditions.
Therefore, the bears will look to extend the current pullback towards 1.3324 or lower, to 1.3294. On the other hand, the bulls will look to pounce on rebounds at about 1.3379 or higher, at 1.3407.
GBP/USD Technical Analysis (the Daily Chart)
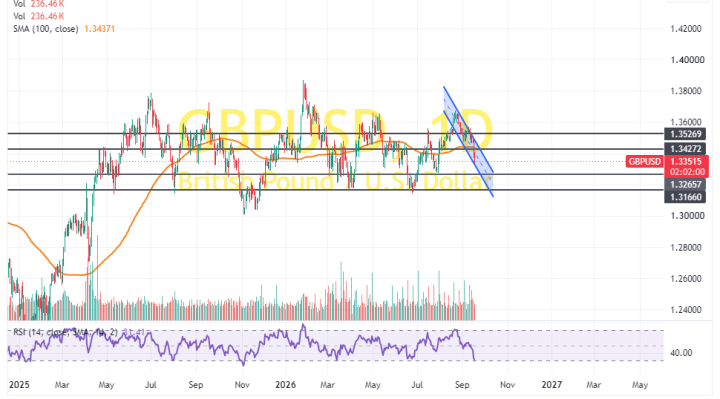
In the daily chart, the GBP/USD currency pair also trades within a descending channel formation. The 14-day RSI also supports a long-term bearish bias as it moves closer to oversold conditions.
Therefore, the bears will look to stretch the current pullback towards 1.3265 or lower, to 1.3166. On the other hand, the bulls will look to pounce on rebounds at about 1.3427 or higher, at 1.3526.