
U.S. Stocks Stabilize as Investors Buy the Dip in Tech
U.S. stock indices attempted a recovery during the session as investors stepped in to buy the dip across artificial intelligence and technology shares following Friday’s sharp sell-off. The tech-heavy Nasdaq Composite led gains, rising 325.847 points (+1.25%) to 26,465.881, while the broader S&P 500 advanced 43.01 points (+0.56%) to reach 7,702.45. Meanwhile, the Dow Jones Industrial Average (DJIA) traded mostly flat with modest upside, gaining 35.30 points (+0.07%) to trade near 52,037.71
Dow Jones Industrial Average
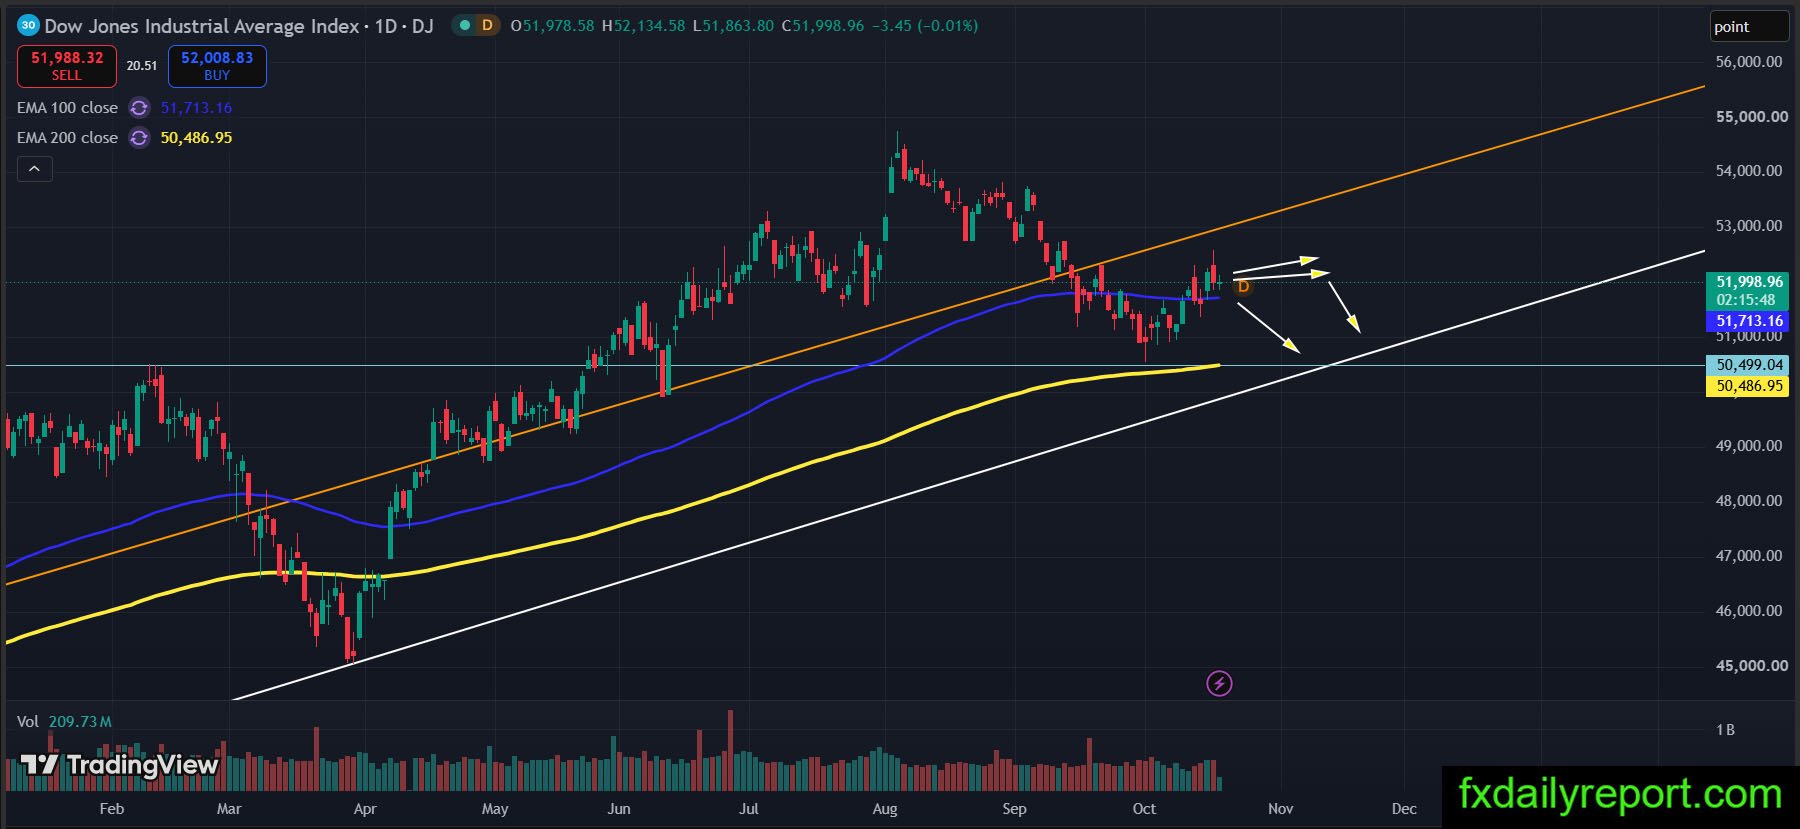

The Dow Jones Industrial Average remained mostly flat with little gain today following Friday’s sharp drop. Price action continues to hold above the daily EMA 100 ($51,713.16), attempting to establish short-term stability. If the index turns lower again, it will likely target the major ascending trendline support below. Furthermore, a breakdown from current levels could print a lower swing high on the chart, which would signal underlying technical weakness and open the door for further downside toward the daily EMA 200 ($50,486.95)
Hudbay Minerals Inc. (HBM)
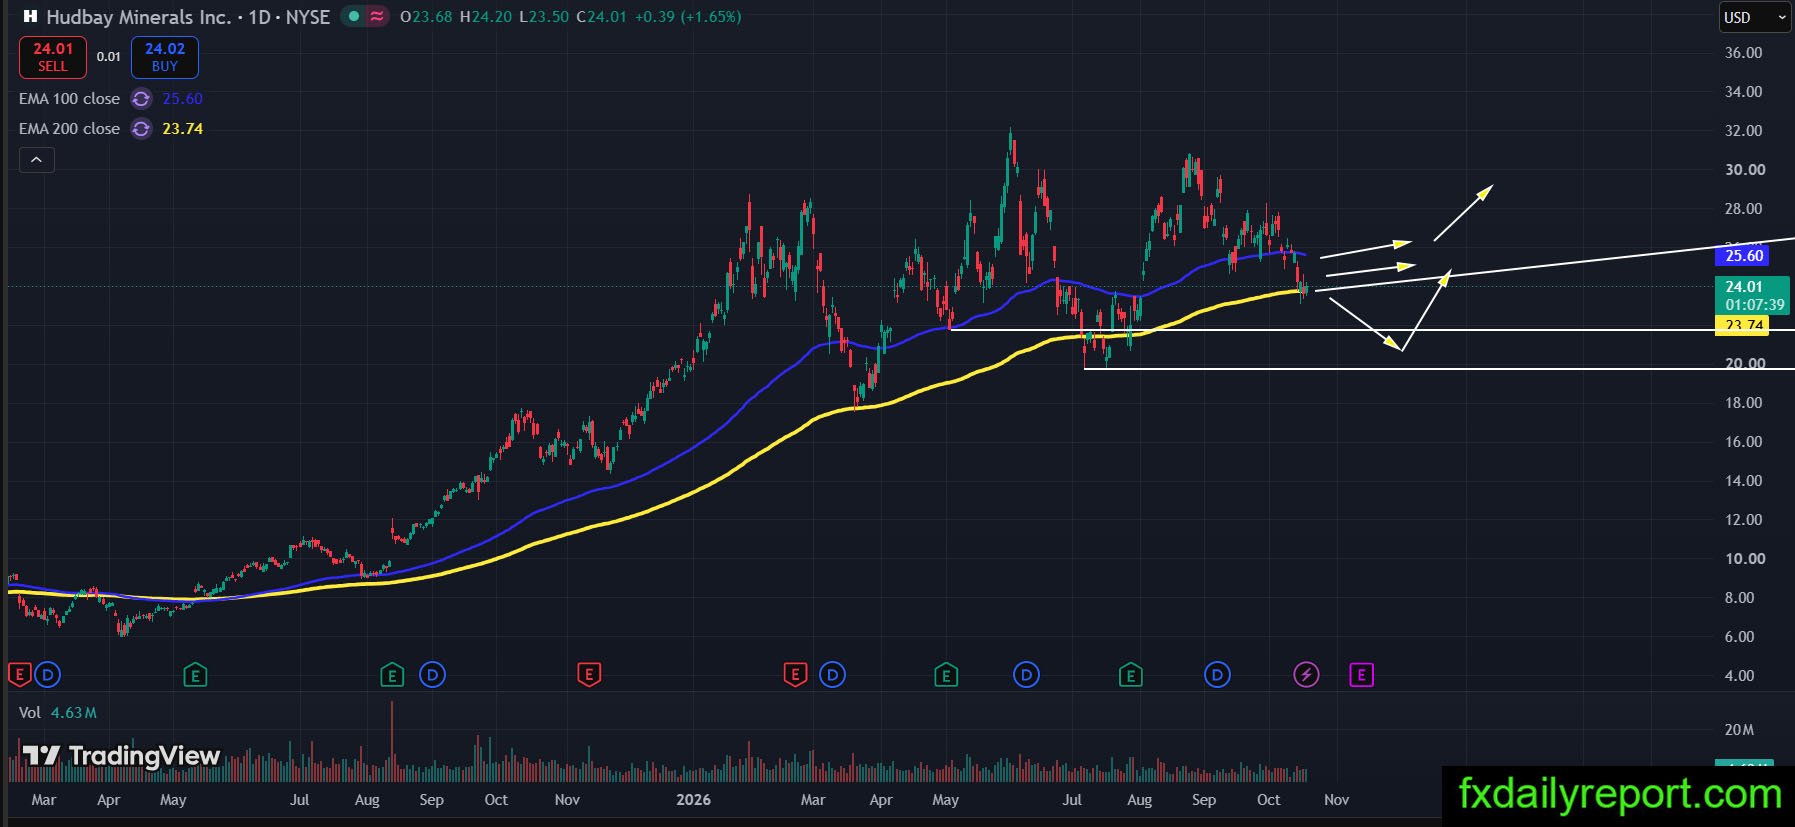
Shares of Hudbay Minerals Inc. (HBM) are currently located at the daily EMA 200 ($23.74), a key dynamic support level where price action successfully bounced during two previous downturns. The stock was trading up 1.65% at $24.01 during the session. If buyers defend this area once more, we might see another bullish bounce and upward continuation aimed at printing a new swing high above the daily EMA 100 ($25.60). Traders could look to utilize moving averages to position for long entries, establishing risk management stops below the previous swing low around the $19.50 level.