
Silver long-term technical analysis
July has been an interesting month for silver as the price experienced sharp sell-off below its long-term support level and spelled all bear to the market. However, the situation quickly reverses, and silver start moved up to erase all losses in just six days. Initially, down to as low as $14.415 (may differ, depend on brokers), the price closed back above $16.00 on 17th July.
The price continues higher in August after rejection from $16.80. North Korea nuclear threat is the reason why the price of precious metal could move higher. Under the current situation, the rally incited by rising tension might continue but will die out if peace resolution reached.

Click here to see previous Silver long-term technical analysis July 2017
Monthly chart
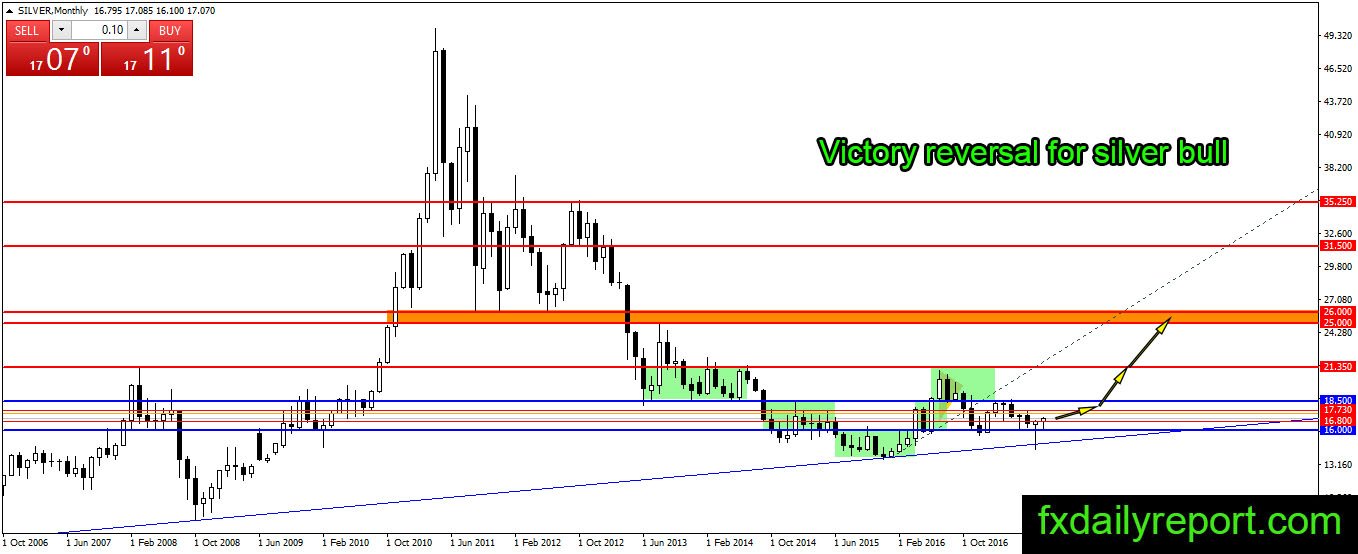
Silver on the monthly chart closed as bullish pin bar in July trading month. It is bullish and translated as “Trapped bear” at the low of the candlestick. The price should continue further upside this month and reach $18.50 in several weeks or months. Traders could use this opportunity to look for a long position with the stop below $16.00 with a very long-term target above $18.50.
Weekly chart
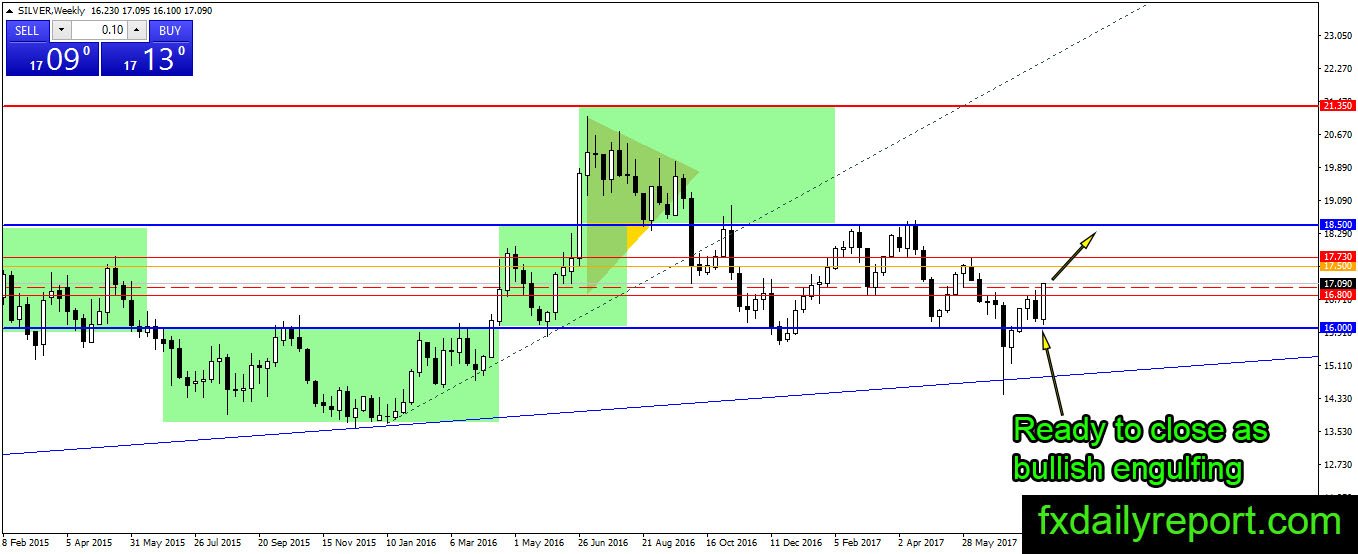
Silver on the weekly chart show adjacent situation as a monthly chart. Both charts tell a bullish story with a target at least at $18.50. If the price closed above $17.00 on the weekly chart, silver would produce a bullish engulfing pattern which strengthens the bullish view.
Daily chart
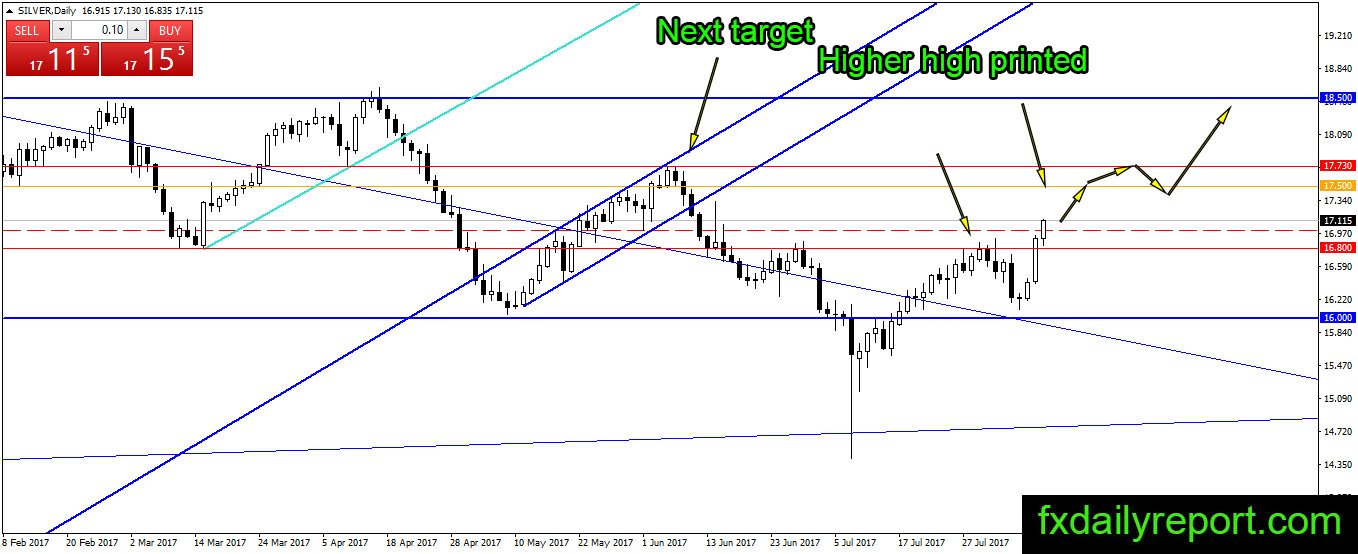
Silver on the daily chart also bullish as the price moved above the previous swing high and created higher high. $17.50 – $17.73 is the area to watch for a bearish reaction. Traders could use broken $16.80 – $17.00 as a place to look for a long position if pullback happens.
Trade plan
Bullish: Breakout above $17.00 already happen, and traders now will wait for successful re-test of the broken resistance.
Bearish: Short position could be taken from $17.50 – $17.73 or at higher level $18.50