
BBBY Long-term outlook

The existence of BBBY is under threat as retail doom & gloom continue. In the previous analysis, the company stripped from Nasdaq-100 and down into the burning road. Since the company stripped from Nasdaq-100, it lost nearly 35% of its value from Dec’16 close $40.64. Calculated from its record high $80.82, BBBY has lost 66% of its value.

Both numbers show grim situation for the company and others in the retail industry. The share price decline has not shown a sign of stopping yet. The company needs to innovate and span its portfolio soon. Otherwise, it might get out of the business.
New Month
Monthly chart
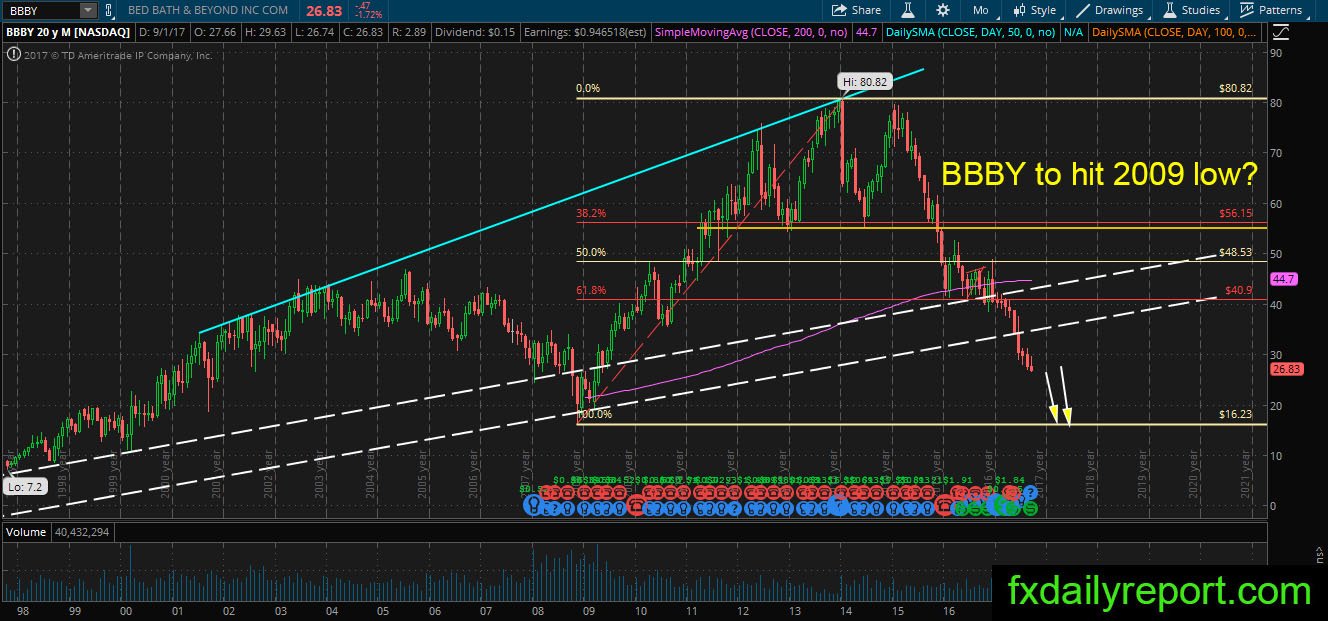
The loss accelerates since the share prices dent its monthly SMA 200. December close below the SMA and company stripped from Nasdaq-100 put the share prices under heavy selling. The selling is fundamental, and the business is in trouble. Technically, BBBY might continue lower to reach 2009 low at $16.23.
Weekly chart
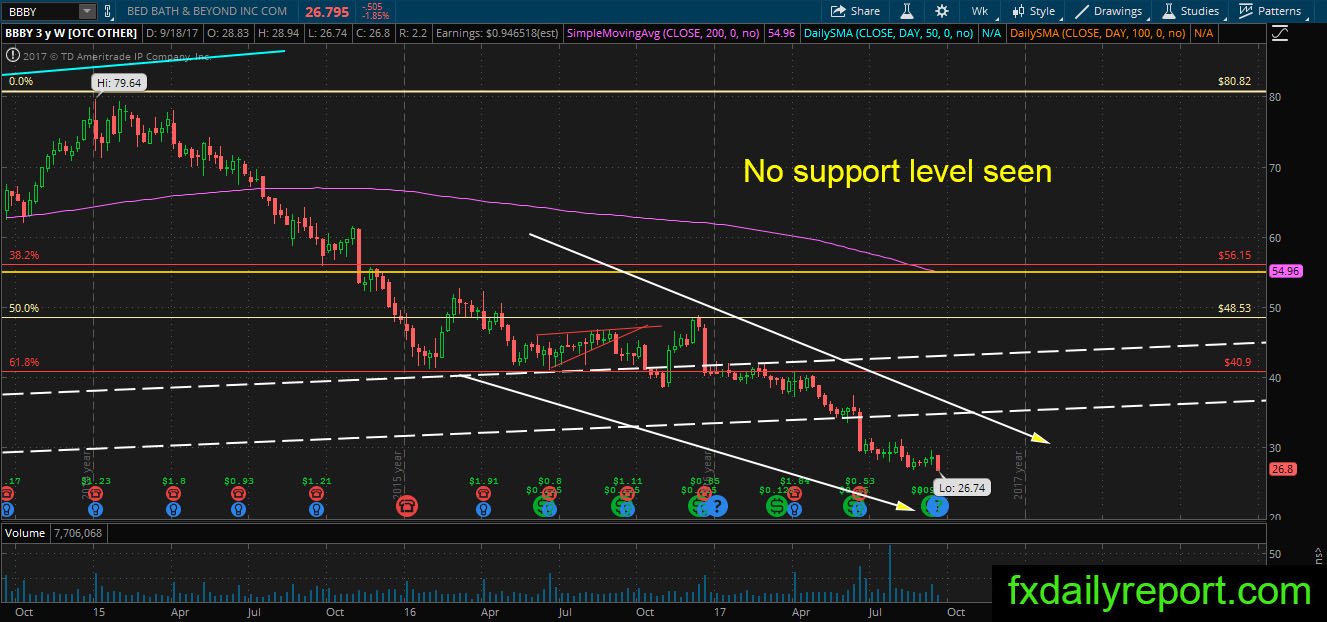
BBBY on the weekly chart consistently bearish and there is nothing to write at the current point as no support level seen yet.
Daily chart
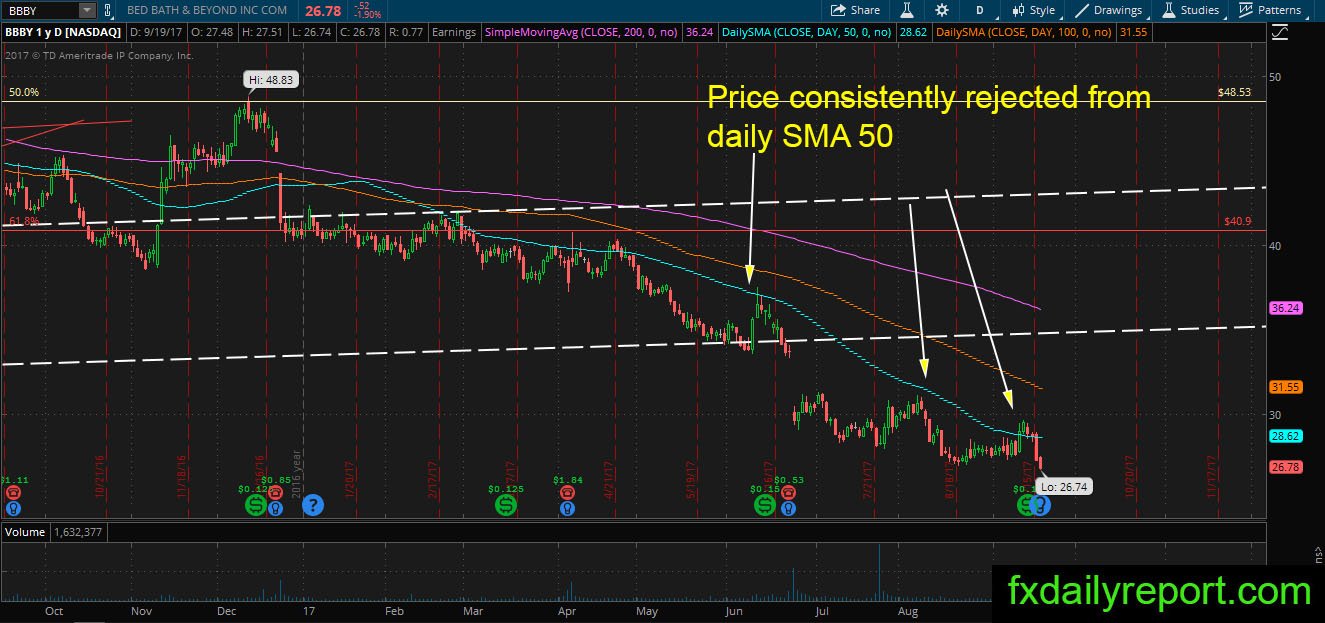
Similar to the weekly chart, BBBY daily chart only confirms the trend is bearish as the share prices receive the continued rejection from the daily SMA 50. As long as the share prices stay below SMA 50, it is bearish.
Trade plan
Long position might need to wait until the share prices hit 2009 low at $16.23
A short position could be taken near the daily SMA 50