
CAT Long-term outlook

CAT share prices receive more upgrades in September which drove share prices up from $117.49 to $124.71. The bull is in charge even in October. While this article was written, CAT bull dominated the market at $130.42. There is no reason to short this company share prices yet. However, 24 October might provide different opinion after the company reported its quarterly earnings result.

Since April this year, CAT has booked six consecutive bullish months with gain from $91.00 to $132.12 record high or a 45.2 % gain. Will the share prices continue moving up before President Trump Tax-reform announcement?
Click here To look at September CAT analysis
New Month
Monthly chart
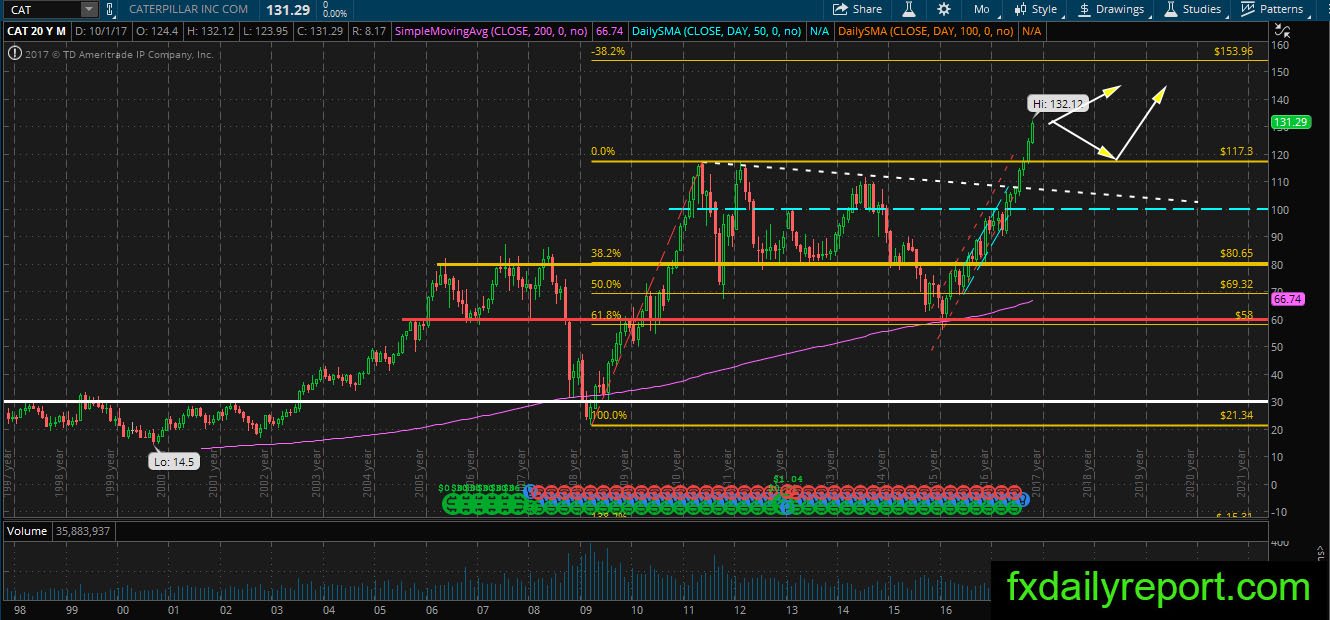
CAT bullish performance continue in September and October following new record high printed on its monthly chart. There is nothing to stop the upward movement yet. Traders who are looking for the long position might need to wait until the share prices return to breakout level around $120.00.
Weekly chart
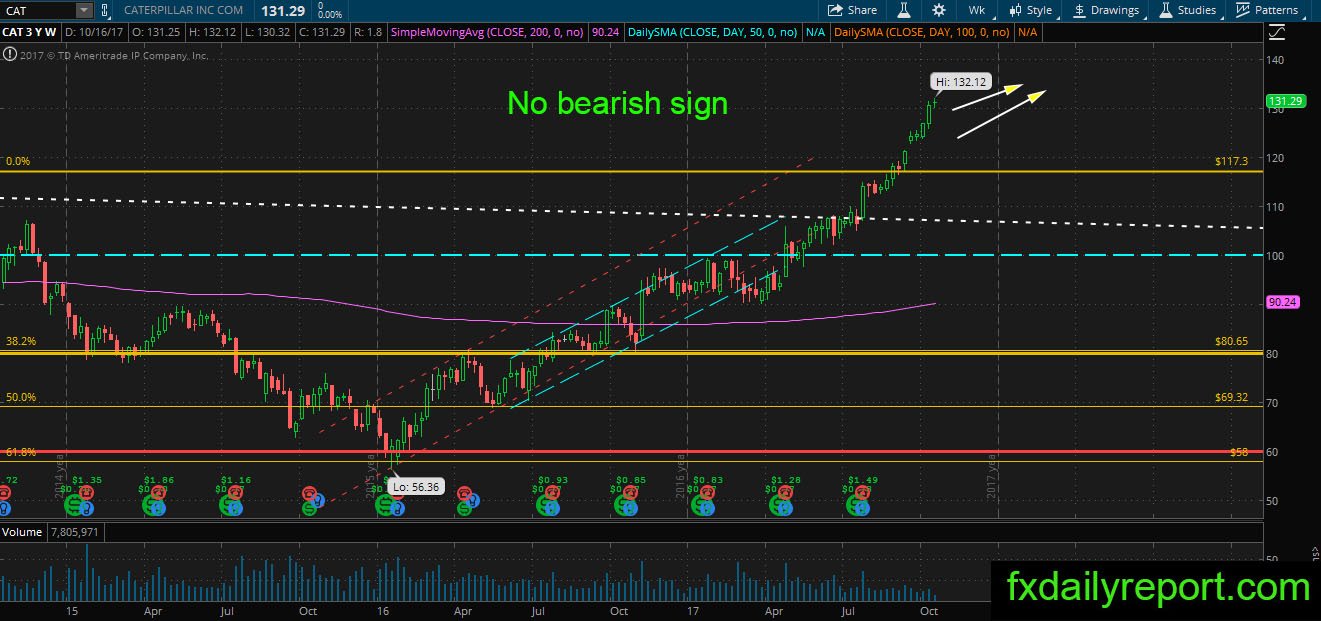
Similar to its monthly chart, CAT on the weekly chart is extremely bullish after the break of $120.00. There is no suggested positions traders could take aside from the long from $120.00 after re-test.
Daily chart
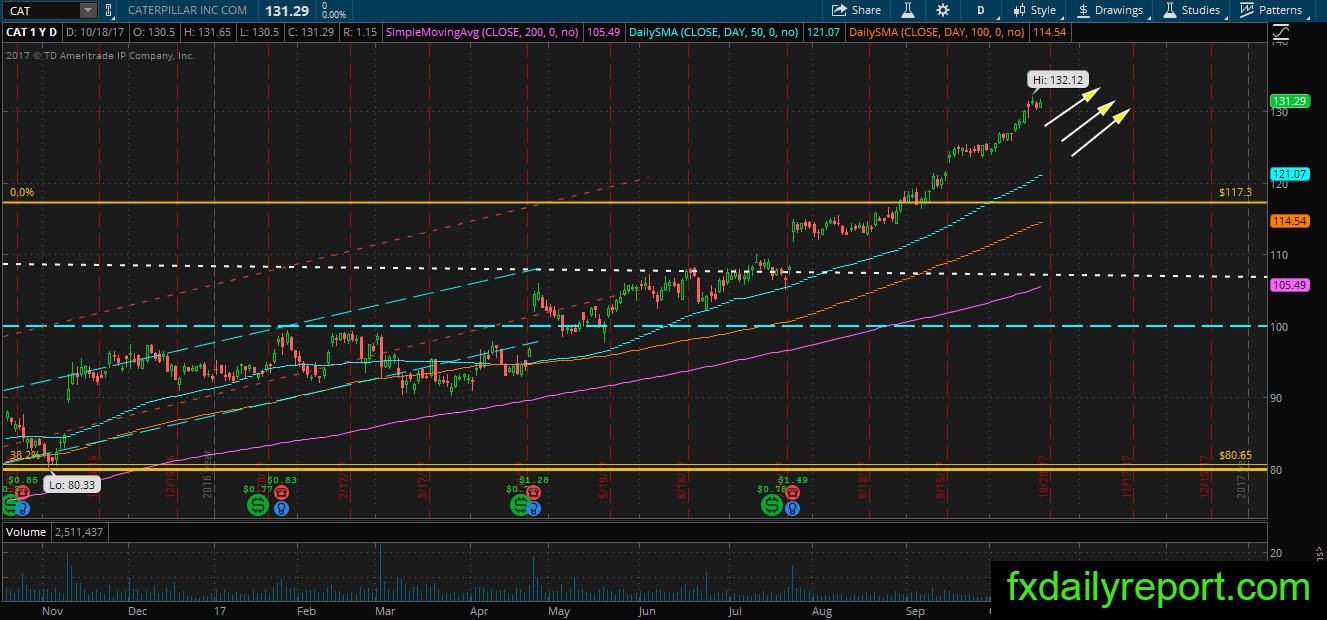
The daily chart of CAT also show price hanging near the record high, and there is no bearish sign yet. $130.00 is the psychological level which could act as support or resistance level. Currently, it is better for traders to wait for a pullback before placing any position.
Trade plan
A long position could be taken near $120.00 support after re-test
The short position might need to wait until bearish pattern emerge. Currently, the share prices surpass $130.00 and showing no weakness. It is better to wait and see.