
KO Long-term outlook
Coca-Cola upward movement in September reversed abruptly and produced negative close. The close is lower than August low which blows concern for traders who are long. Fortunately, the negative sentiment does not continue in October, currently KO up $1.33 or 2.9% at $$46.38 from its opening level $45.05.
The company scheduled to report earnings result on 25 October before market open. Analysts think there is more downside to the company share basing on valuation. However, the company long-term restructuring effort by selling its bottling operations might speak different result. The selling of bottling operations will provide

The selling of bottling operations will provide the company with more capitals as there is less capital to commit to operations. Aside from that, the company could refocus its attention on developing new products line and apply expansive strategy rather than defensive strategy the company follows past years.
Fundamentally, the stronger number in next week report could help the company share prices move higher above its yearly high.
Click here to see KO September analysis
New Month
Monthly chart
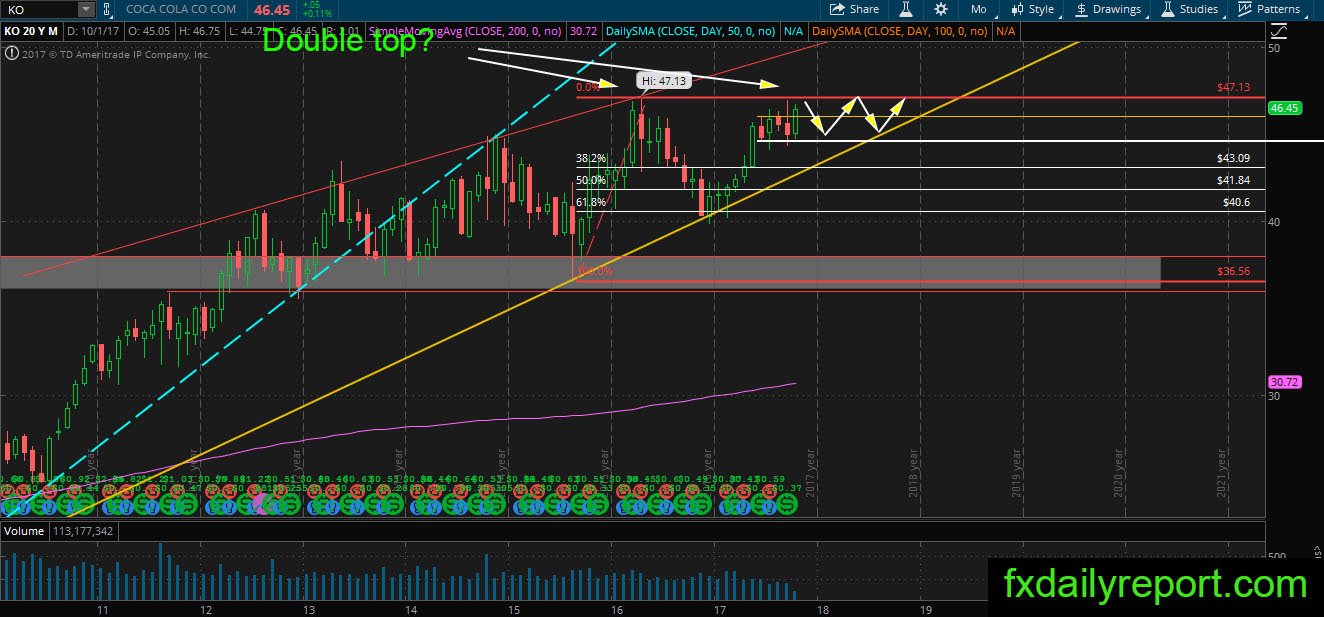
KO is on the verge of creating higher high on the monthly chart. The share prices held below $47.00 in the previous month attempt higher. On October, there is hope for the bull as the share prices moving back near $47.00 resistance. Overall, KO range of movement span between $44.50 – $47.00 and it might continue moving inside it until breakout.
Weekly chart
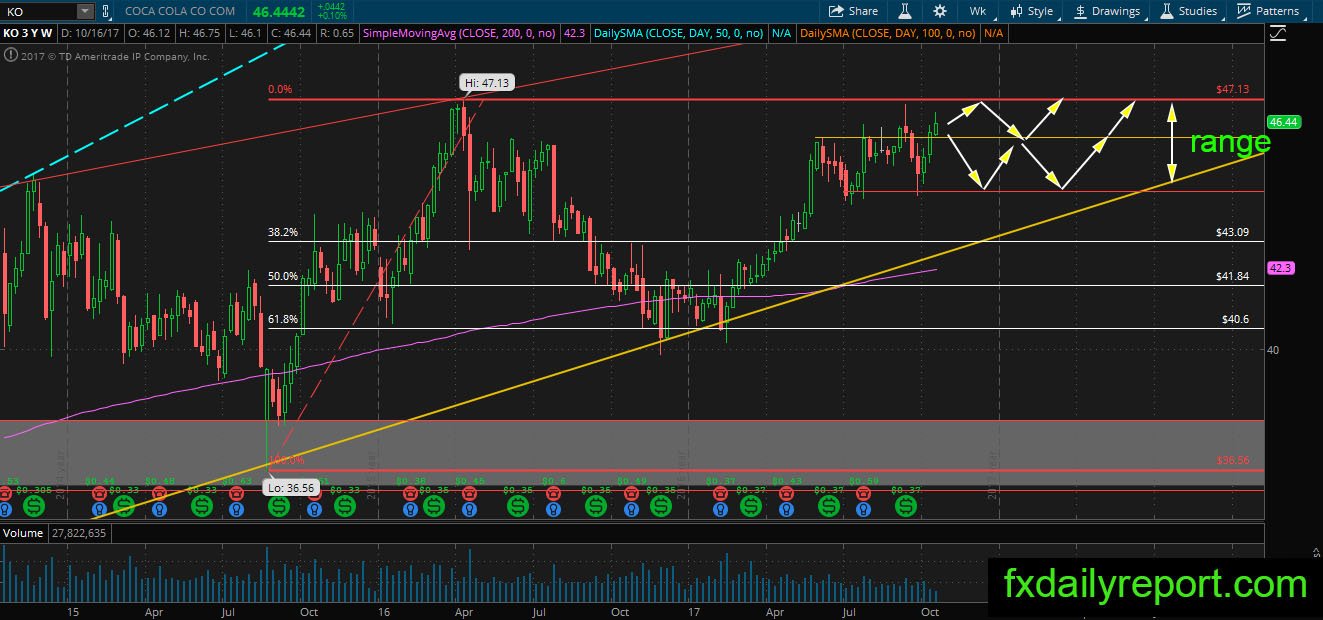
The range on the weekly chart is the same as the range on the monthly chart. KO expected to test the top of range $47.00 and continue sideways. Traders could trade the range $44.50 – $47.00 until breakout happens.
Daily chart
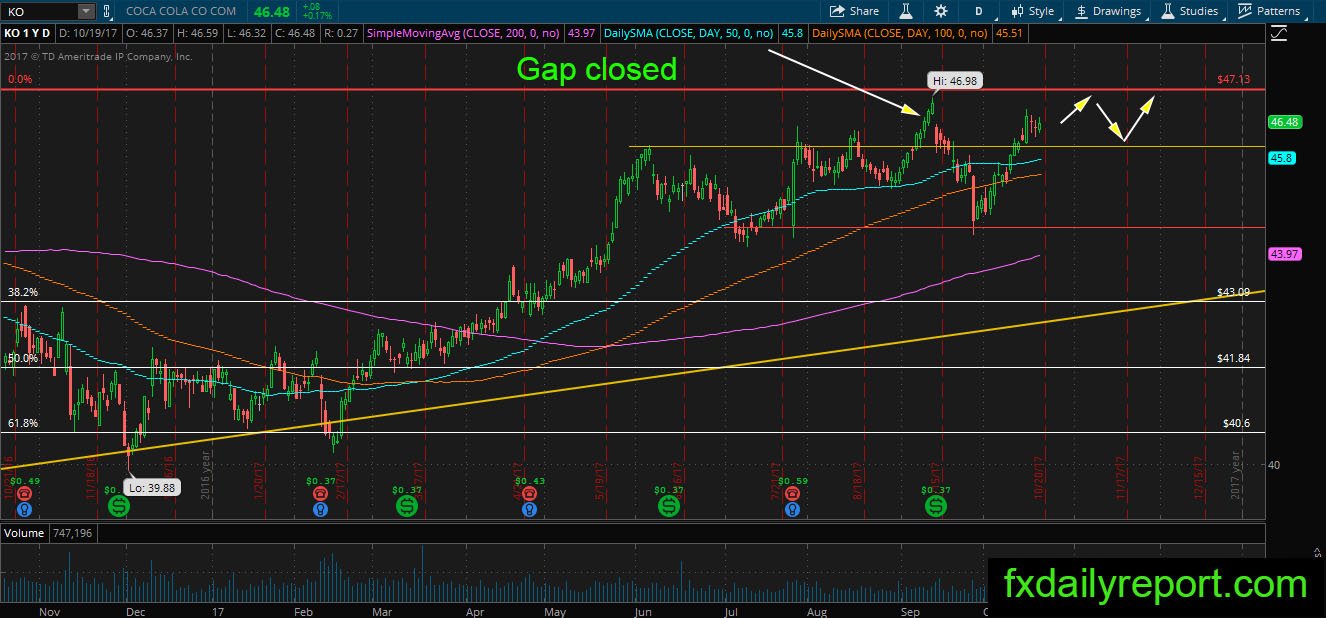
KO looks more bullish on the daily chart. Traders could see the share prices closed the gap from the previous yearly high gap down. The closure of gap most of the time result in reversal, but KO bull continuously maintains position near the gap level. If the bull could bring the price higher, it might trigger short squeeze run above $47.00.
Trade plan
A long position could be taken near $46.00 – $46.50 with the target above $47.00.
A short position could be taken after bearish pattern emerges near resistance $47.00.