
WMT Long-term outlook
Walmart (NYSE: WMT) is in buying spree last year with known brand purchase such as jet.com, ShoeBuy, Bonobos, Moosejaw. The buying spree will continue as the company geared to compete against Amazon. Aside from buying spree, recently Walmart ally with JD.com and Tencent to face another giant in China, Alibaba (NASDAQ: BABA).
The result of company decision is bright, and share prices have climbed 36.2% from this year low $65.28 to $88.92 high. The company announces share buyback program on 10th October which discussed as an attempt to appease institutional traders & investors. On another note, according to SEC compiled data, 16.7% of shareholders criticize company policy on high executive pays.

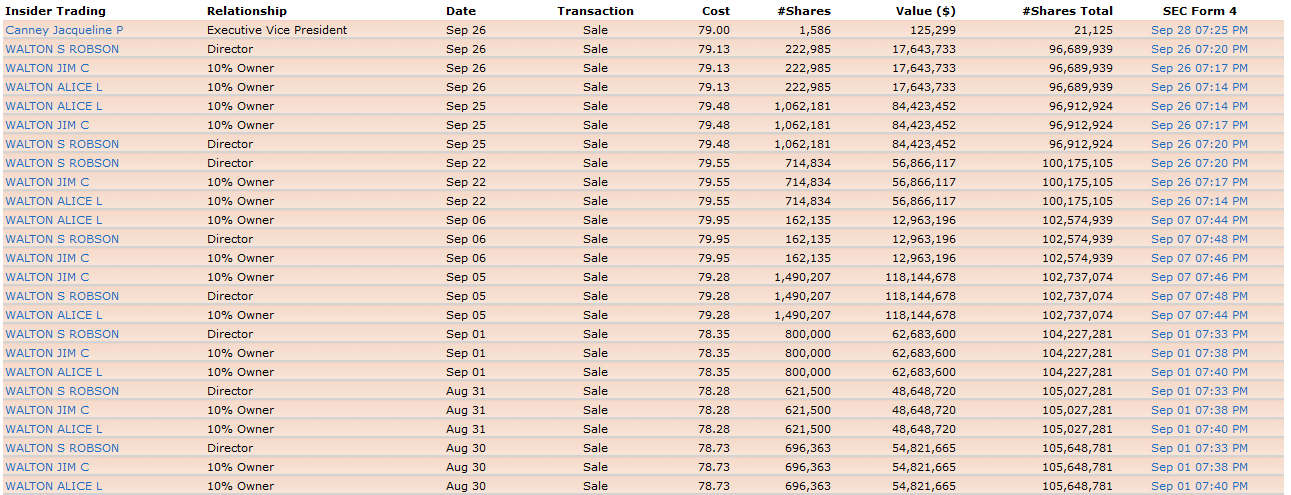
Nevertheless, insider transaction of WMT is not beautiful as selling continuously done without any insider buying since March 2017.
Click here to see WMT April analysis
New Month
Monthly chart
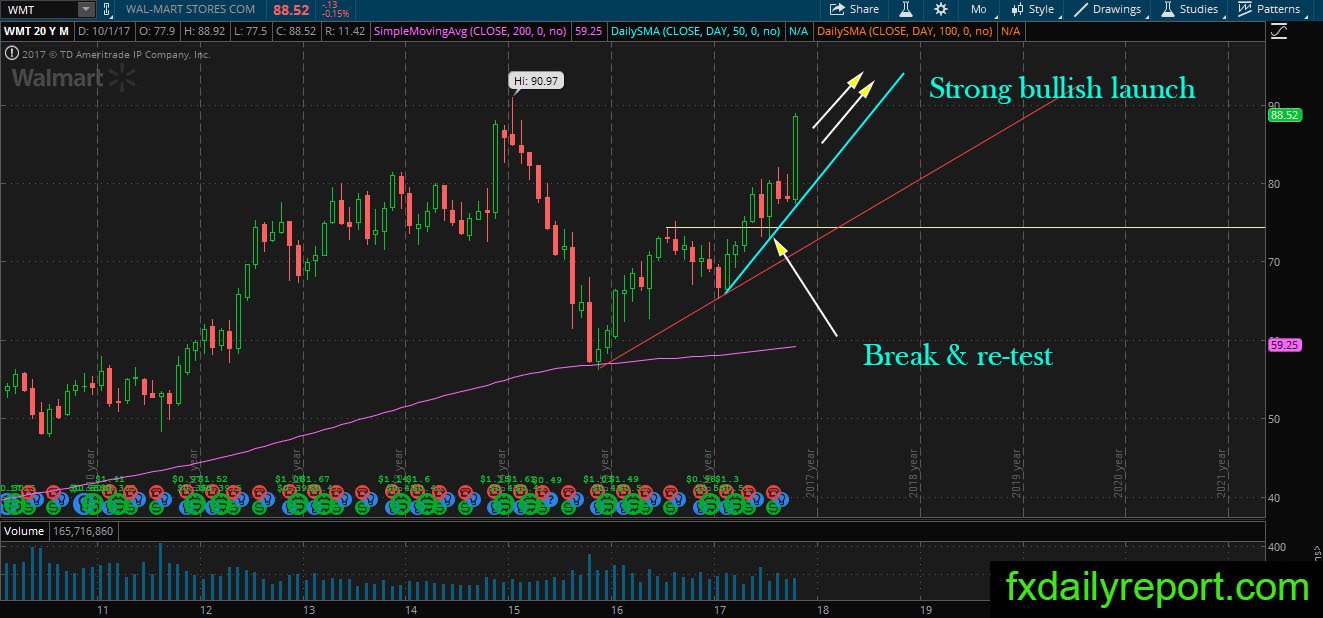
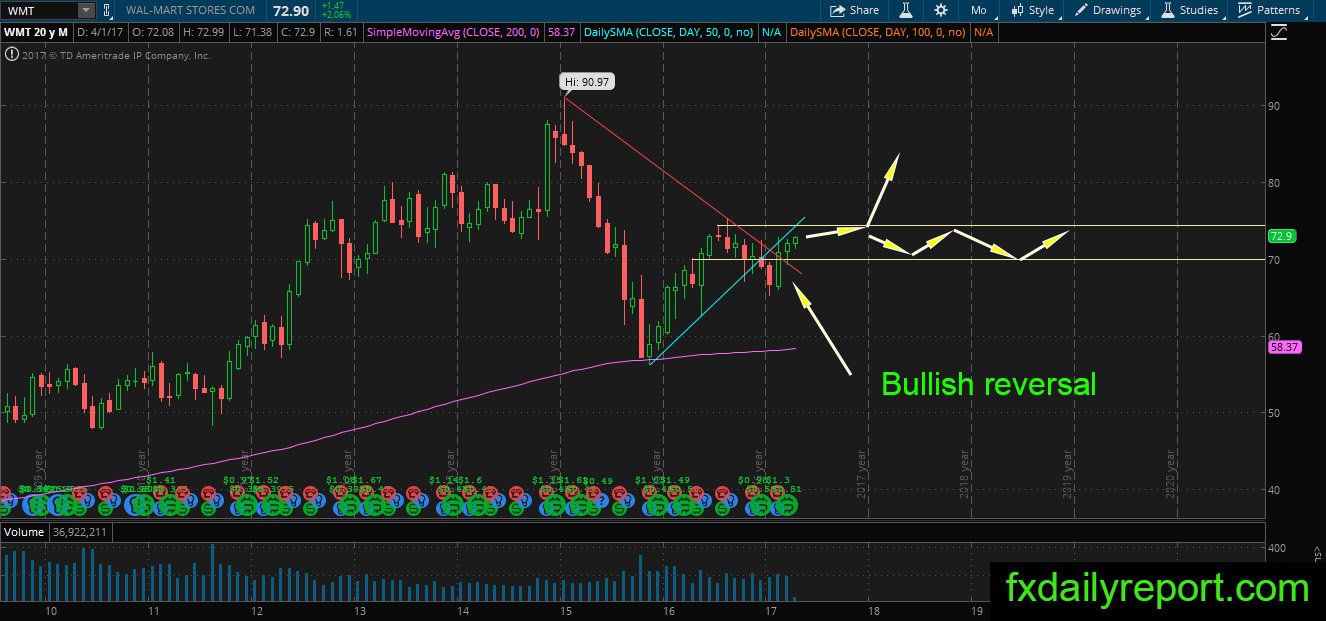
On March, the share prices of WMT trapped inside $70.00 – $75.00 range, and May show the breakout above the range. Since the breakout, share prices maintain a level above $75.00 and never close below it. Finally, October bull launch WMT near its record high. It is only a matter of time the bull will overtake the record high.
Meanwhile, the nearest support traders could use to enter a long position is around $80.00 – $82.50 or the blue trendline.
Weekly chart
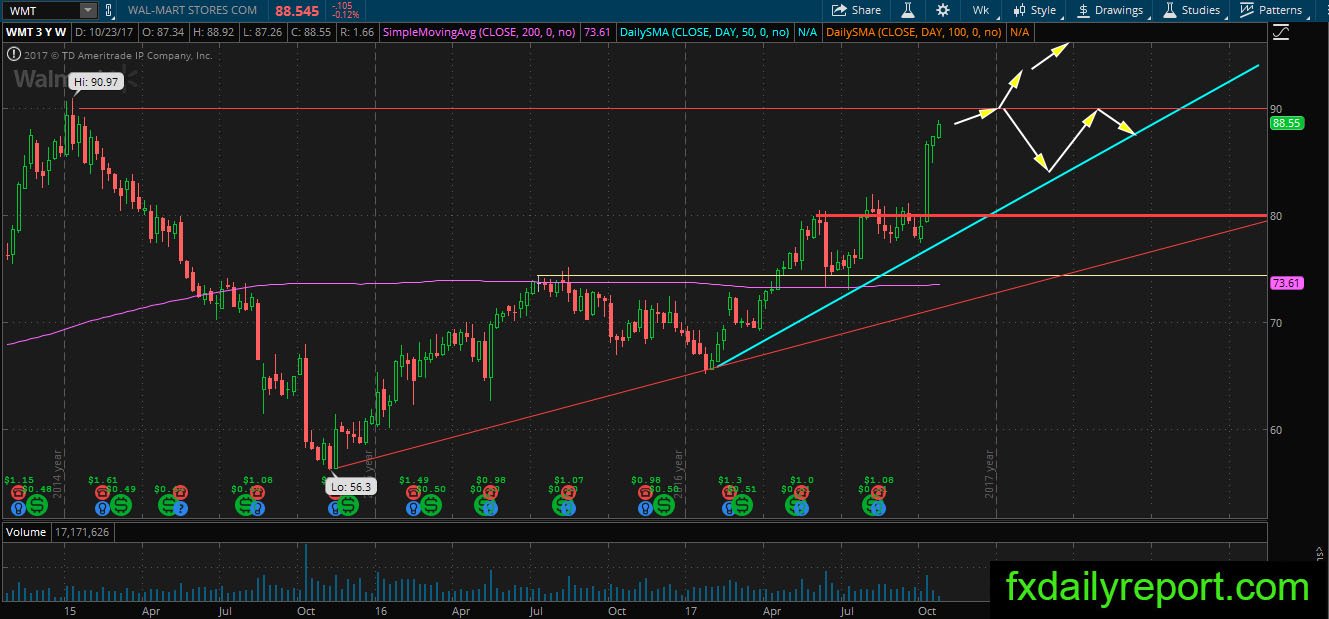
The train has left the station and there are not much action traders could do at the current time. WMT will reach $90.00 resistance and might break above it to print new record high. The only possible trade to look is the long position when there is a retracement to the blue trendline. A short position is not interesting as bullish momentum strong.
Daily chart
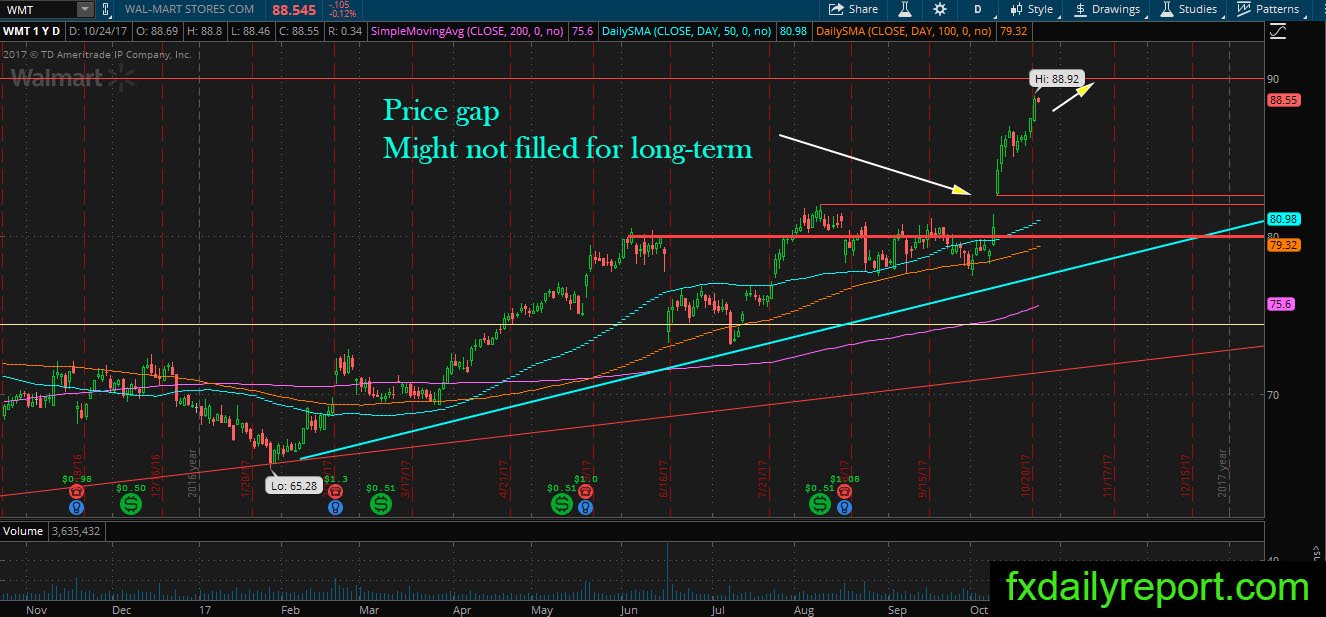
Price gap on the daily chart happened on 10th October where Walmart announce share buyback program. The share prices might not return to this level for a long time. Overall, traders will enter wait & see mode until $90.00 resistance cleared or price rejected from it.
Trade plan
The long position needs to wait for a retracement to the blue trendline or area between $80.00 – $82.50.
The short position needs to wait until bearish formation formed near record high