
U.S dollar index long-term technical analysis
U.S dollar index suffered heavy selling this year. Initially, the index gained on 2016 as the Fed announces an interest-rate increase. However, the optimism could not lift the index in 2017 as the market already priced in hawkish Fed. On the other hand, the index continues under pressure as other central banks start scaling out and thinking above interest-rate hike.
Fortunately for U.S dollar, analysts and investors think the bounce is due and expect bounce could happen in the third or fourth quarter of 2017. Traders could see U.S dollar index building ground on the fourth quarter, and it is only a matter of time before the actual bounce happens.
New Month
Monthly chart

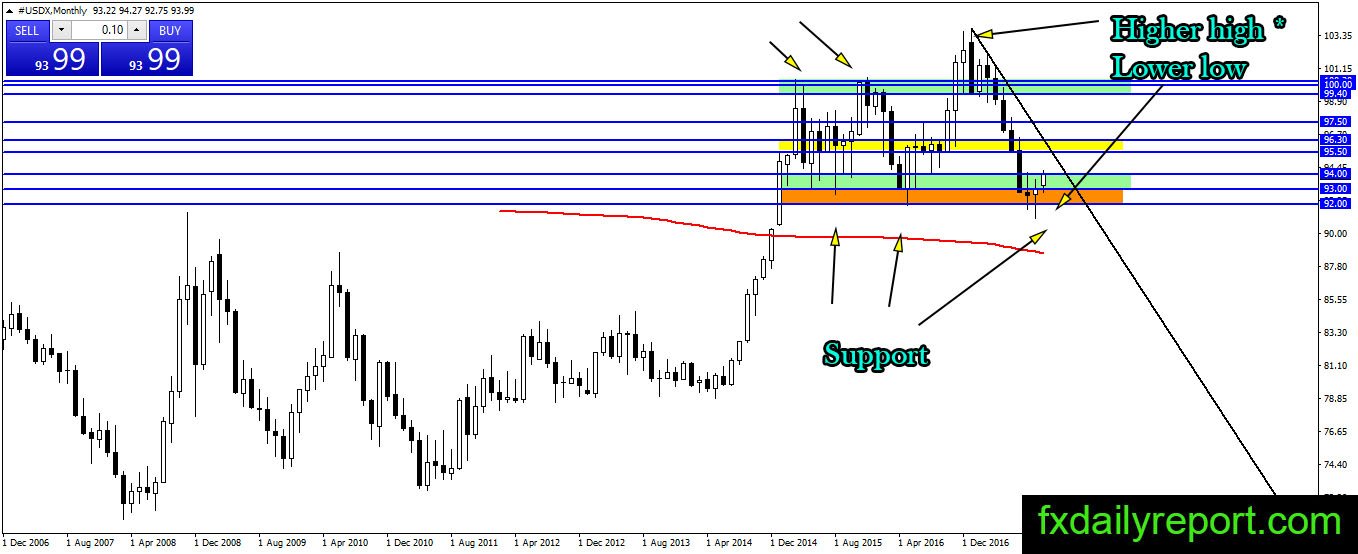
U.S dollar index on the monthly chart showing positive sign in the latest two months. The candlestick closed as bullish pin bar and the bull followed through in October by a break higher above the candlestick high. If the index could close above 94.00, there is possibility for long-term bounce.
Weekly chart
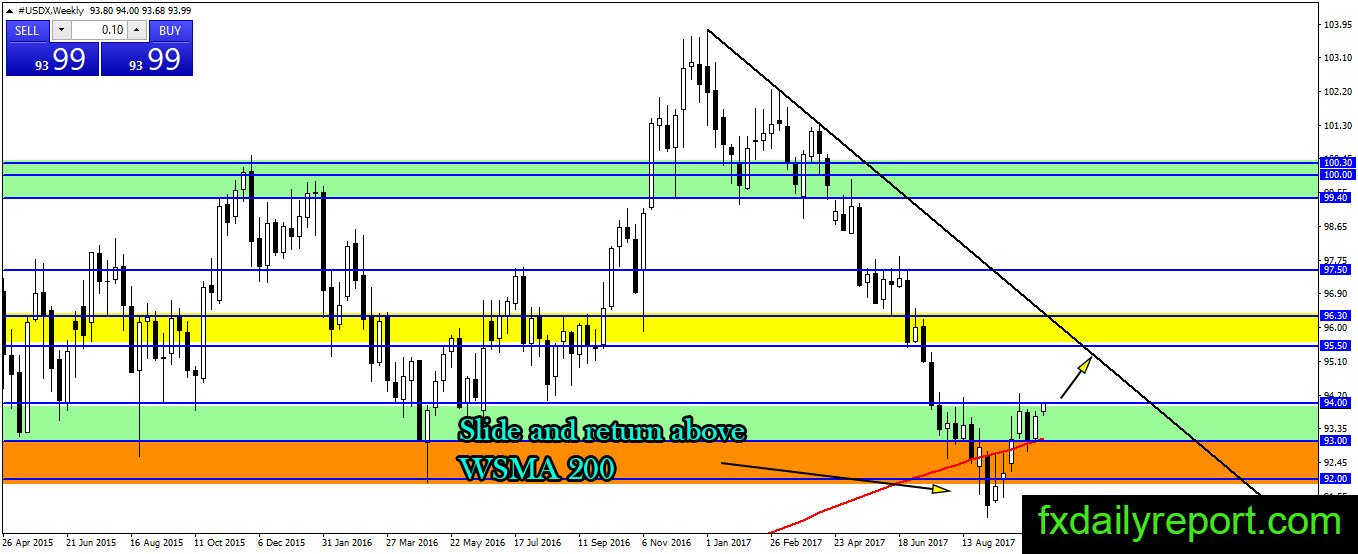
The only notable event on the U.S dollar index weekly chart is the slip below WSMA 200 and return above the averages. The index maintains the bullish trend and will attempt to move higher toward the black trend line. The close above 94.00 is vital for short-term bullish continuation. On the other hand, a close above the black trendline is needed for long-term bullish continuation.
Daily chart
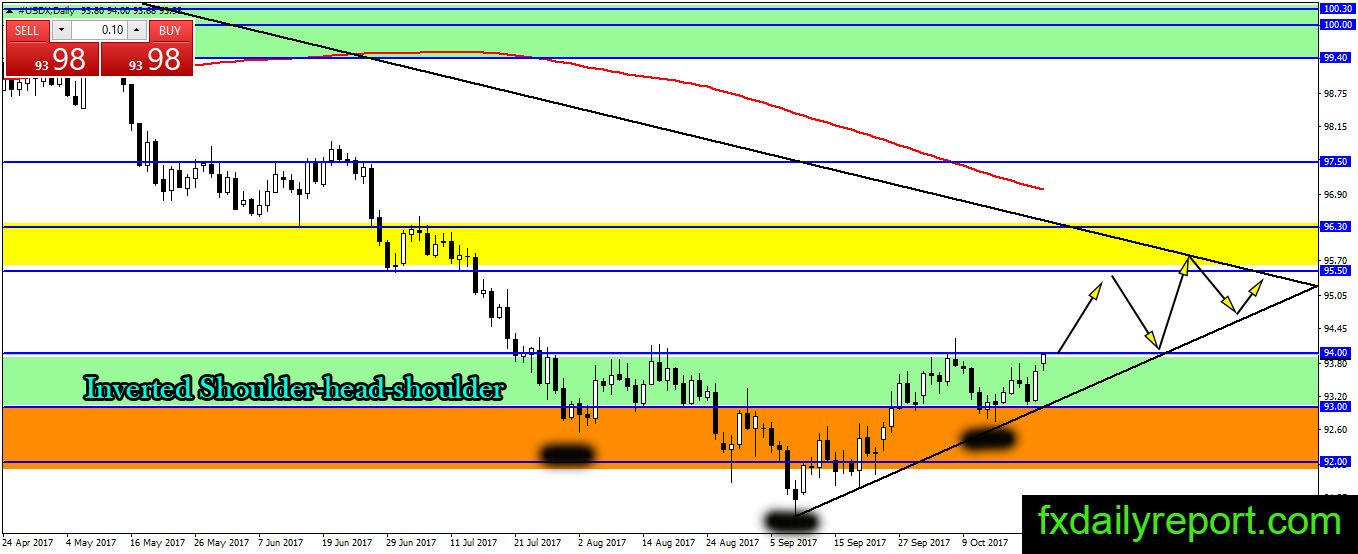
The pattern of U.S dollar index on the daily chart is bullish following the inverted shoulder-head-shoulder pattern. The bull need a breakout above 94.00 to confirm the pattern. On the other hand, there is black support trendline where the bull must defend. A slip below the trendline or 93.00 will trigger further selling to test the yearly low.
Trade plan
Long position could be taken from black trendline on the daily chart. Alternatively, a break and re-test of 94.00 also better option to take.
Short position from 94.00 is possible as long as the index stay below the resistance. Long-term short position might be present near the trendline shown on the weekly chart.