
EUR/USD long-term technical analysis
The development of EUR/USD stays subdued as the pair hesitate to move past the monthly SMA 200 resistance and the pair traded inside 400 pips range since the close of January. Investors and traders look taking a defensive position as geopolitical situation tensed this year.
China-U.S trade wars issue is the biggest situation which becomes hotter each day. The situation followed by U.S-Syria military action joined by the UK. Traders might want to adopt risk-averse approach under current market.

Click here to see EUR/USD long-term analysis March 2018
New Month
Monthly chart
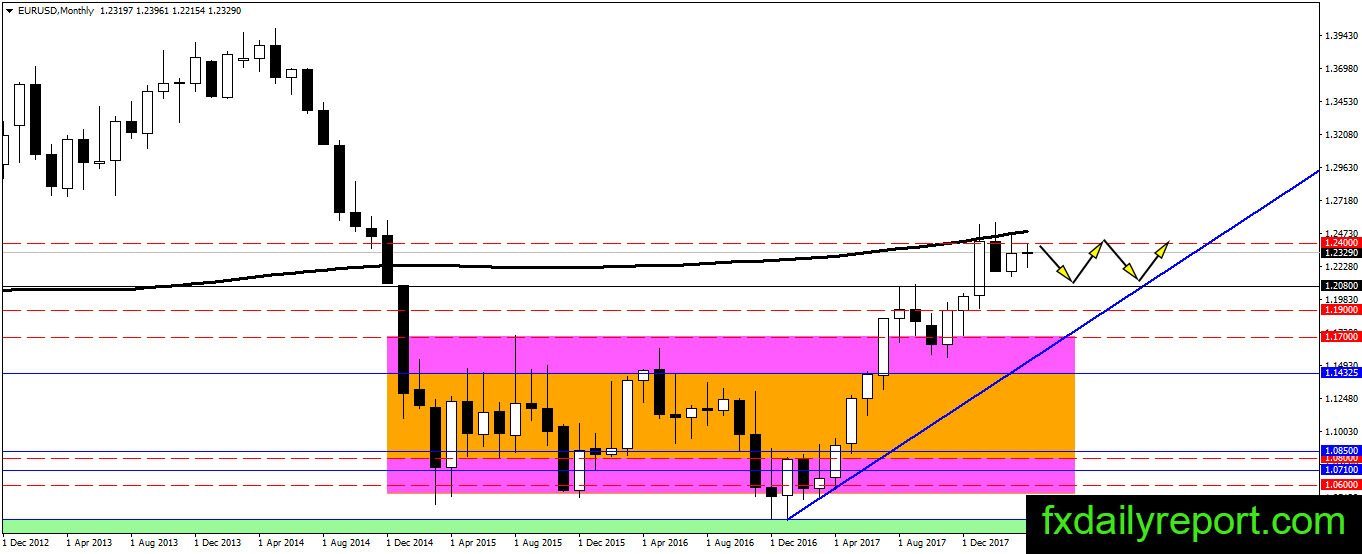
EUR/USD progress below the SMA 200 and no indication of breakout or correction yet. The pair sticks near the averages and waiting for either breakout trigger or rejection. There is nothing to do yet on EUR/USD, and it is better to stay sideways or trade the range using small position size.
Weekly chart

The prices open and closes inside the green range which gets tighter. Breakout will happen soon, but the range will continue gets tighter first. Traders could use the green box range for reference to take a position.
Daily chart

Green triangle range was broken and EUR/USD gained above 1.2400 before turning down again. The downward movement brought EUR/USD to test 1.2210 which result in a bullish bounce. Currently, the pair slipped again as it approaches 1.2400.
We could expect EUR/USD is moving between the two trendlines shown on the chart while looking for a breakout.
Trade plan
The long position could be taken from area 1.2180 – 1.2210 and at lower level 1.2080. (Same plan as previous month)
The short position could be taken near the monthly SMA 200. Alternatively, the upper blue trendline on the daily chart is also appealing as a level to take a short position.