
Gold fifth monthly bearish close
Gold declined and closed lower for fifth month since April this year. The precious metal continues under backfoot as U.S dollar grinding higher globally. It is an unusual situation for gold as the precious metal usually used as a hedge against inflation and uncertainties. Under current market which has high uncertainties, traders and investors might question why gold moving down.
The logical explanation for the current situation could be traced from gold demand this year. Overall, base on the World Gold Council, the demand trend down 4% in Q2. Central banks notably logged slowed buying of -7%.

Without any change in the fundamental situation, we might see further weakness in gold and traders might want to avoid a long position at the moment.
Click here to see Gold June 2018 forecast.
New Month
Monthly Chart
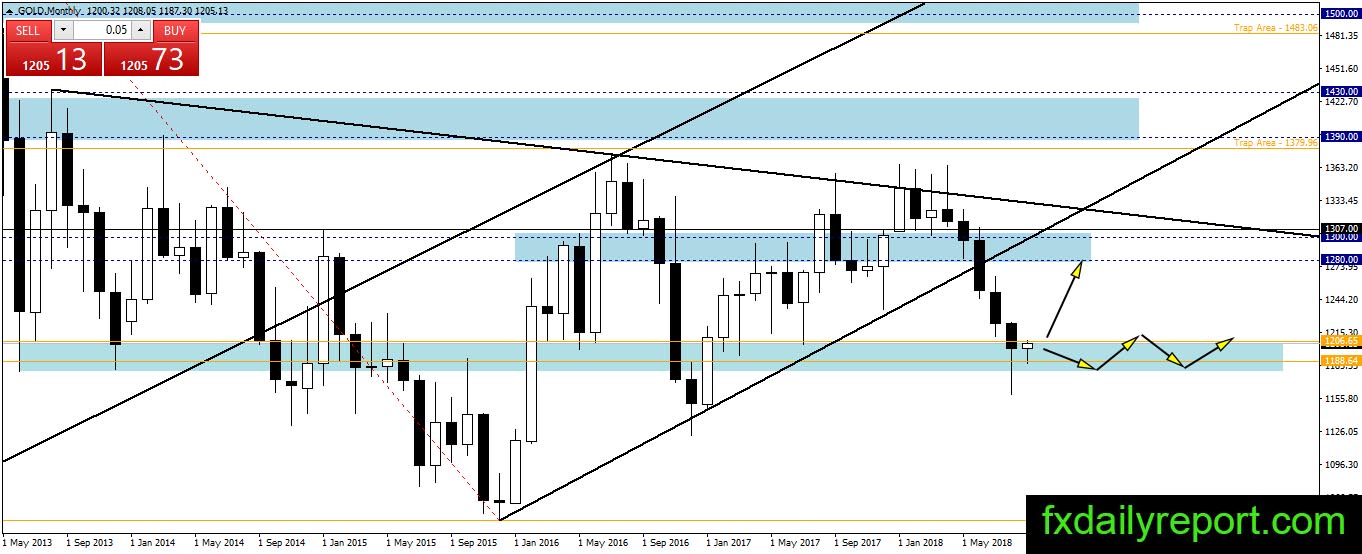
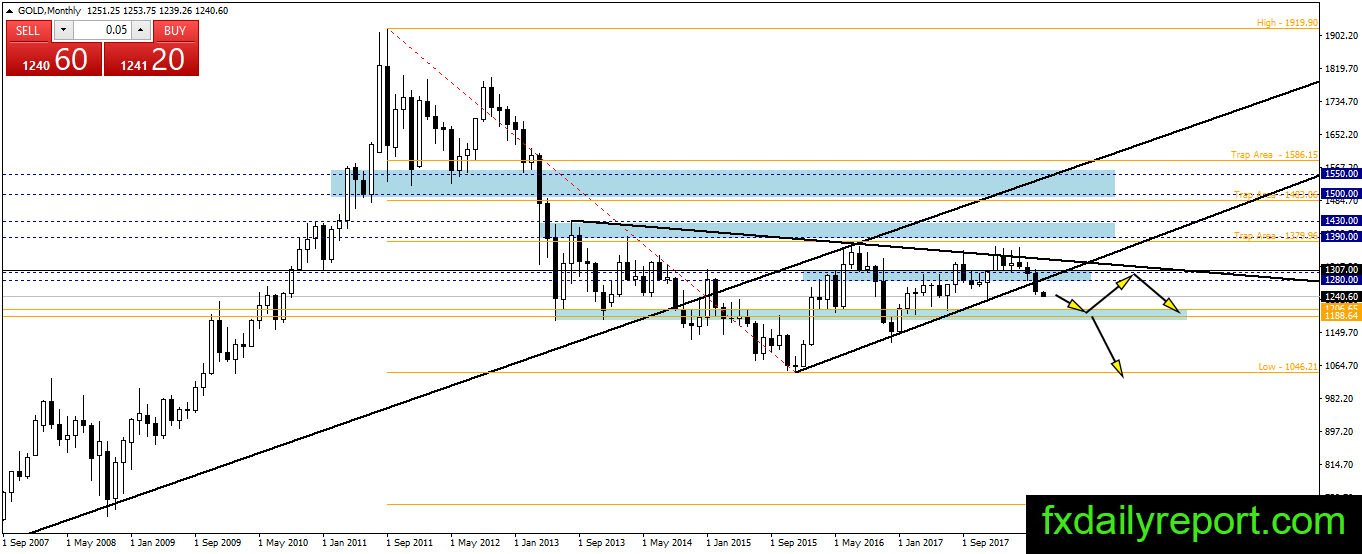
Gold descend continue and reach the blue box area shown on the monthly chart. Currently, there is a bullish reaction at the middle of September and the price attempting to move above the blue box. Traders could use the moment to look for a long position in the shorter time frame as planned.
Weekly Chart
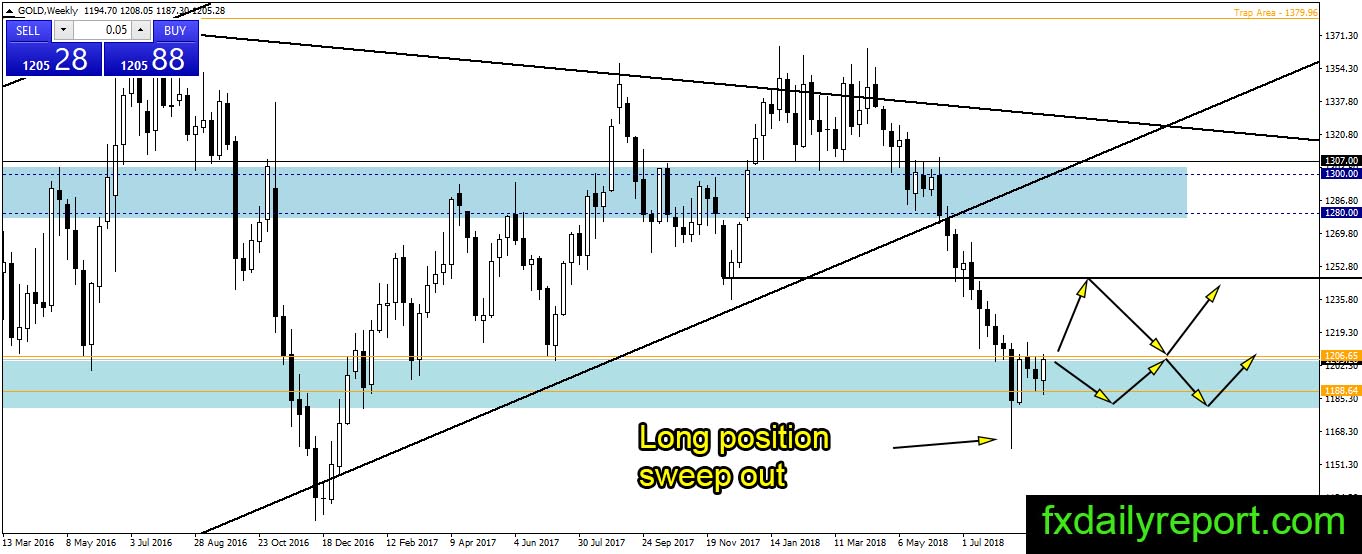
The gold situation on the weekly chart showing an initial indication of bounce. We could see long position sweep out by the bear where the price sharply down but closed above $1,180 (Bottom of our projection bullish area between $1,180 – $1,200). It could mean the bear has reached the objective and gold returned to the bull hand. A close above $1,206 and $1,213 is the key for a bounce.
Daily Chart
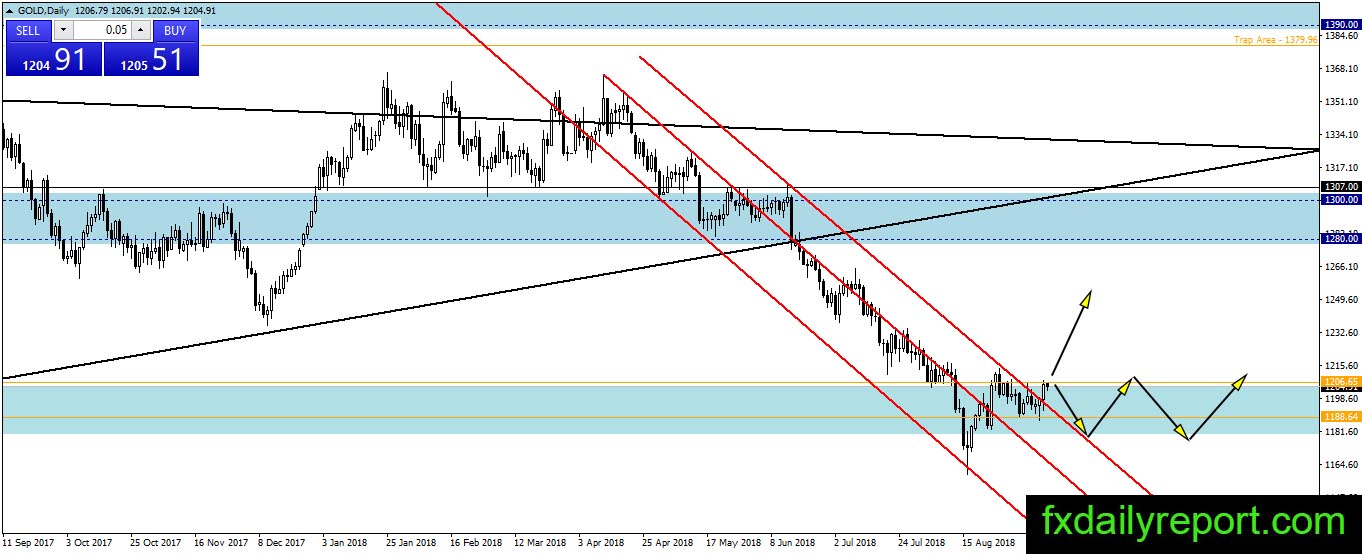
Gold projection previously traded inside the red trendlines area. The price seems to escape from the top of trendline recently and might stage a new bullish trend. The top of the blue box is the resistance area to watch. If gold could surpass the level then we could see a new rally on progress.
Trade Plan
Bullish trade – $1,180 – $1,200 area has been touched and there is a bullish reaction. The price expected to continue upward, traders who hold long position could continue to hold the position. Traders who have no position could wait for another test on $1,180 – $1,200 area.
Bearish trade – Short position around $1,250 is the plan to watch. Another short-term trade to watch is short from $1,206 when the price failed to surpass the level and formed a strong bearish pattern.