
Silver long-term technical analysis
Silver breach the low and printed fresh 2018 low. The price looks cheap, but the bull needs to workout and proves itself first that the bearish trend has stopped. The downward movement might continue to test 2015 low as the level is not far from the current level.
On the other side, U.S dollar continues gaining globally on trade war issue and more rate-hike projection by the Fed. If the fundamental situation continues as following then we could expect silver has not bottomed out yet.

Click here to see previous Silver long-term technical analysis July 2018
Monthly chart
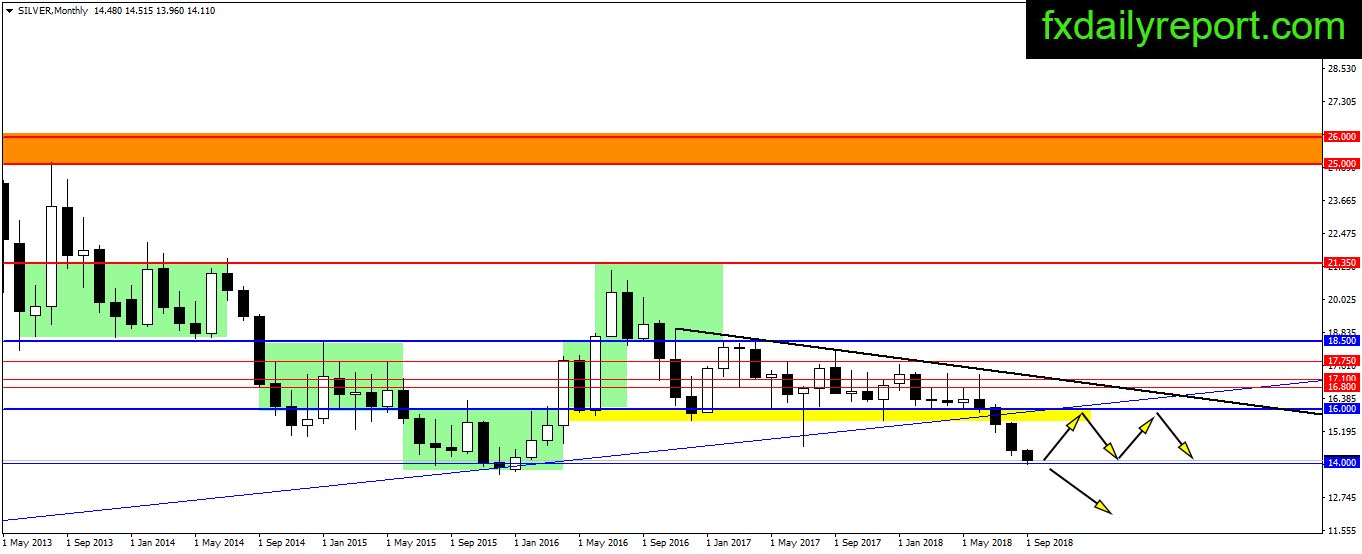
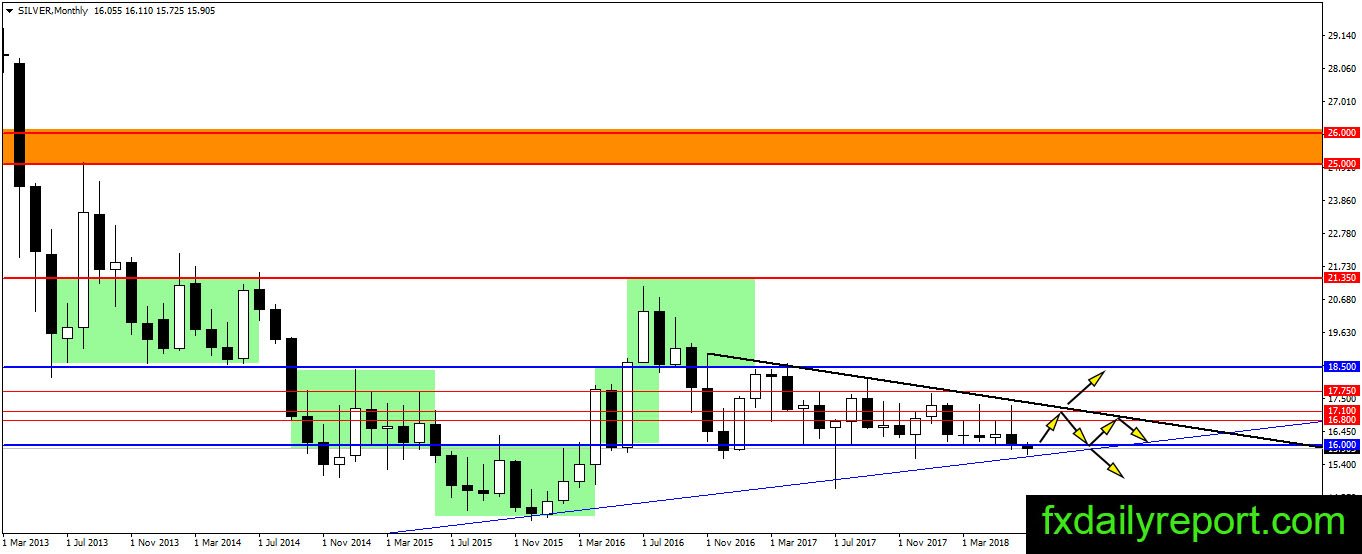
Silver finally lost it and break lower below the triangle pattern. It is the bearish sign and the price currently challenging 2015 low. A breakout below the level will let the precious metal down to test 2008 low at $8.44. Although it is a slim chance, traders might want to include the scenario as possible. Currently, 2015 low is under test and traders could look for long position near the level.
Weekly chart

No bullish sign yet for silver even though the price stick near the support $14.00. It means long position taken will be a speculative long. Despite there is no bullish sign, a long position from current location is a high-odds. Breakout below $14.00 or 2015 to clear stop order is possible though.
Daily chart

Break or bounce is the situation shown on the daily chart. The price of silver is moving inside the bearish channel and might continue inside it. The bull needs a breakout above the channel to reverse the current bearish trend.
Trade plan
Bullish: The best possible scenario for a long position is when the price break above the bearish channel on the daily chart.
Bearish: Short position near current level is shorting to the support level. Wait until bounce to breakout level between $15.00 – $15.50 happen for the safer short position.