
U.S dollar index long-term technical analysis
The winner for September trading month is none, the bull and the bear is in a stalemate situation. We have a similar opening and closing level which is providing no clue. However, traders could take note, the bear is in control the entire month and the bull erases all lose by the end of the month.
U.S dollar index situation turned bullish by the end of the month as the Fed raises interest-rate by 25 bps and affirm one more rate-hike before the end of the year. Moreover, a hawkish sentiment also is thrown for next year. In 2019, The Fed now expects three more rate-hike. Under current hawkish sentiment, we think the path of U.S dollar index will continue upward.
New Month
Monthly chart

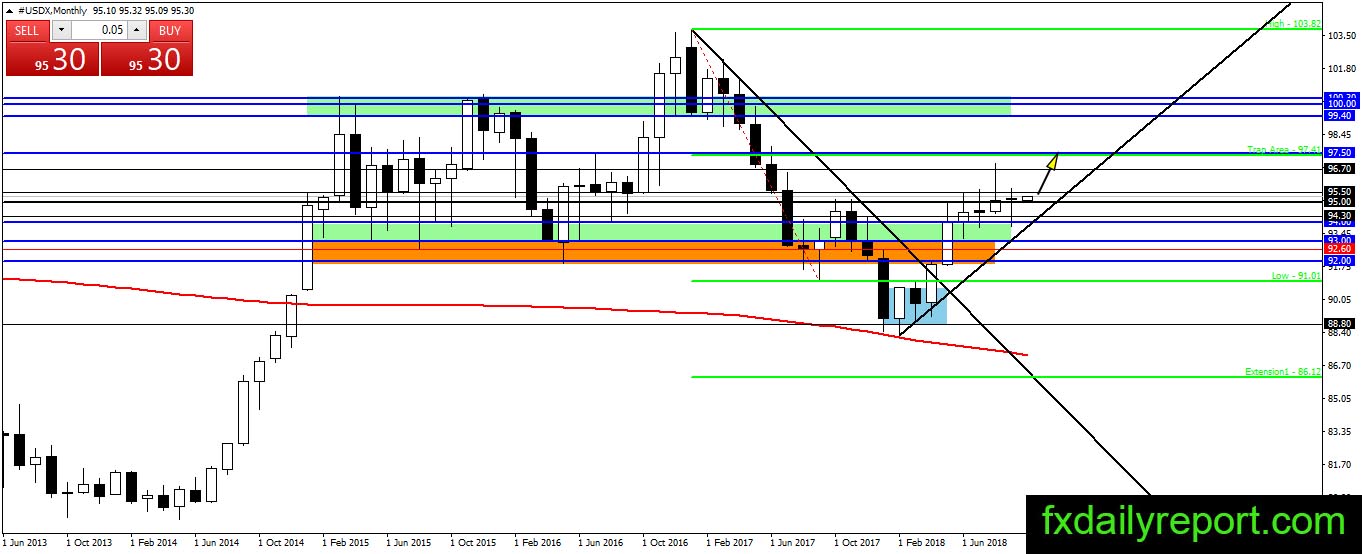
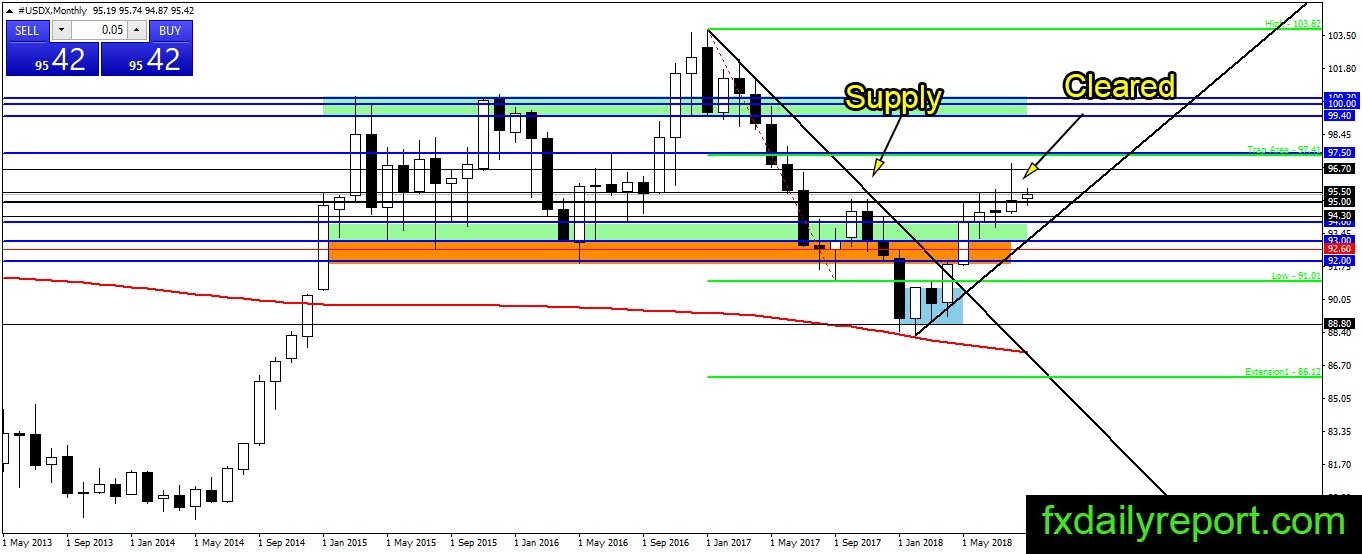
There is correction happened in September which brought the index lower. However, the situation changed after The Fed announce interest-rate and future projection. U.S dollar index returns to its opening level and closes the month near it. It is a bullish sign and could lead to further upside in October.
Weekly chart
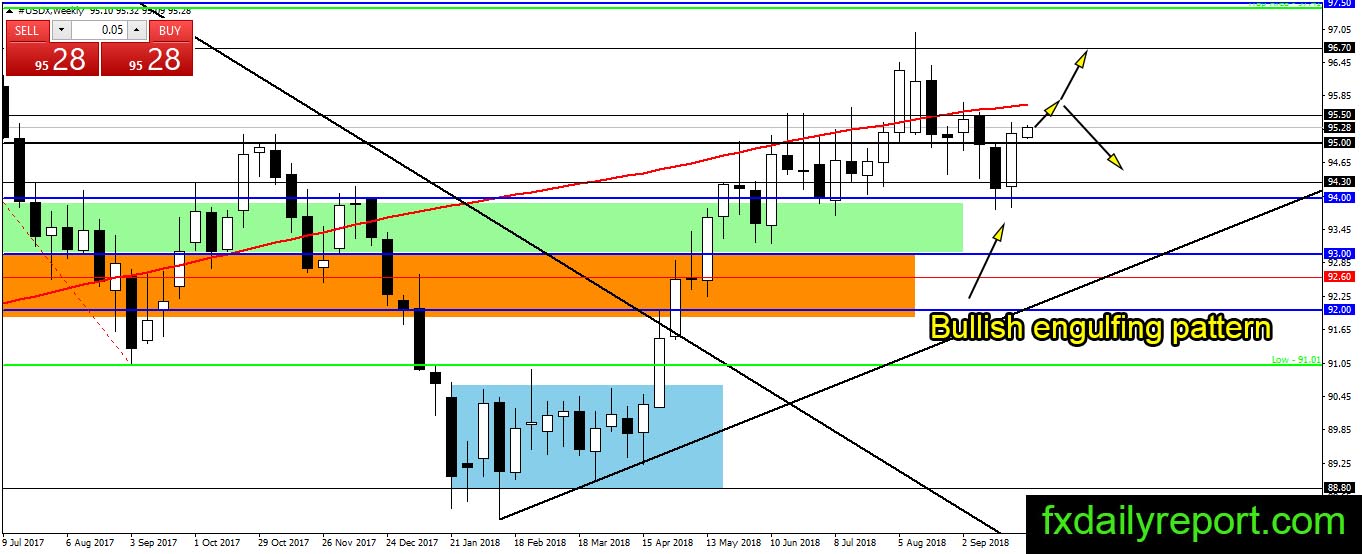
The weekly chart of the U.S dollar index confirmed sell-off from the weekly SMA 200 which is a bearish sign. Fortunately, the selling could not breach 94.00 and print a bullish engulfing pattern. Currently, the pattern has not confirmed yet, the bull still needs to make a close above previous week high and weekly SMA 200.
Will we see breakout or rejection from the WSMA 200?
Daily chart
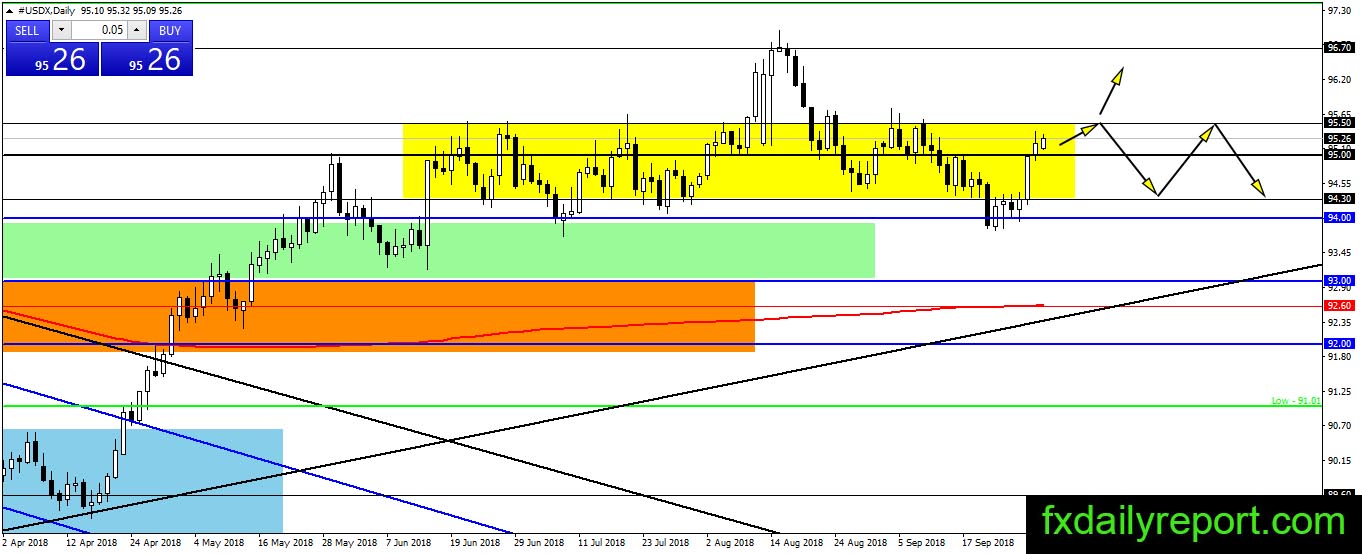
Ranging and no escape yet from the yellow box is the word to speak on the U.S dollar index daily chart. There is bullish momentum in the current movement. However, without breakout above the top of the yellow box then we could expect the index to continue traded sideways inside the box range.
Trade plan (For U.S dollar pair)
A long position is favored as a fundamental situation support it. However, the index still has trouble to break out of the yellow box on the daily chart. As long as there is no breakout, traders will continue sideways with a bullish bias.