
Gold no bullish close yet
September is another bearish month for gold as expected. The price print another bearish close, down from $1,200.57 to close the month at $1,191.56. The strength of U.S dollar and low demand both eating the bull strength. However, the rate of decline slowing near $1,180 – $1,200 area and there is the possibility the bull will reverse the trend from this area.
Despite the possible bullish scenario after a six-month decline, there is no bullish close yet on the monthly basis. Traders who are looking for the long position might want to proceed with caution.

Click here to see Gold September 2018 forecast.
New Month
Monthly Chart
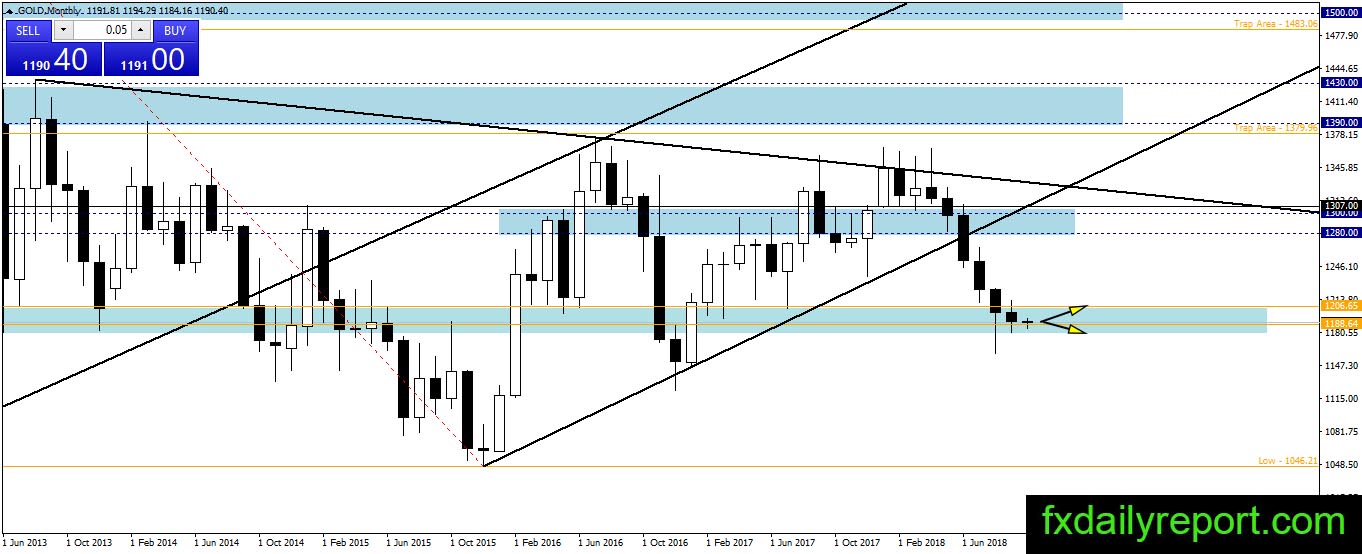
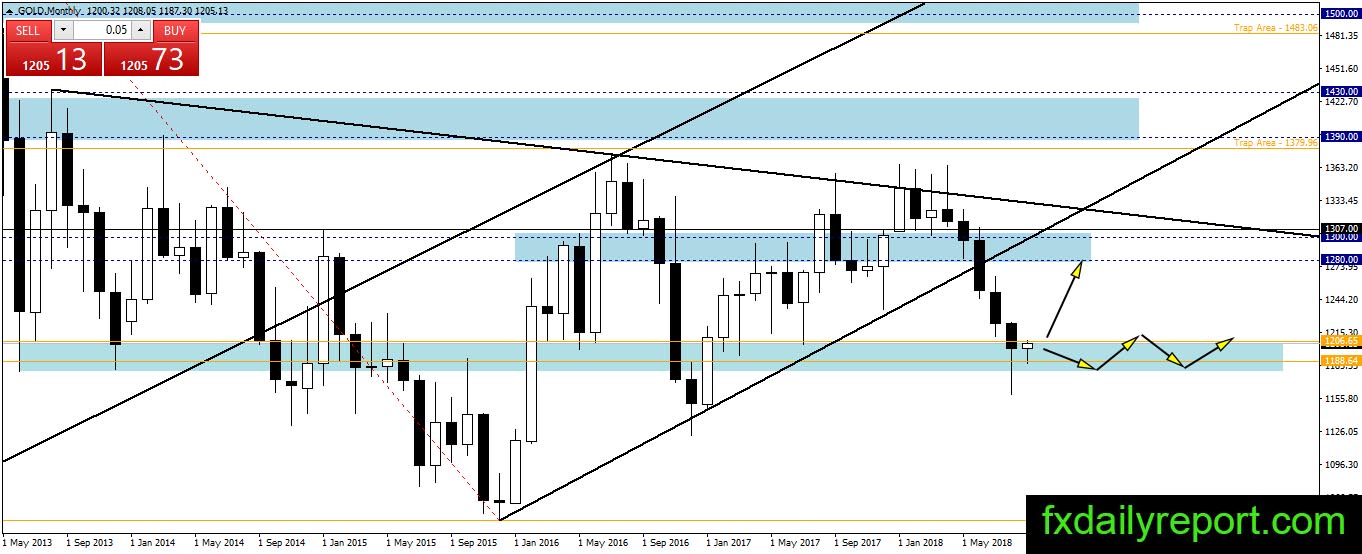
Monthly chart of gold showing the price bottoming out inside the blue box area. However, there is no bullish close yet on the chart and gold price could continue to print lower close. October might become the vital month to determine if gold will bounce or break below the blue box area.
Weekly Chart
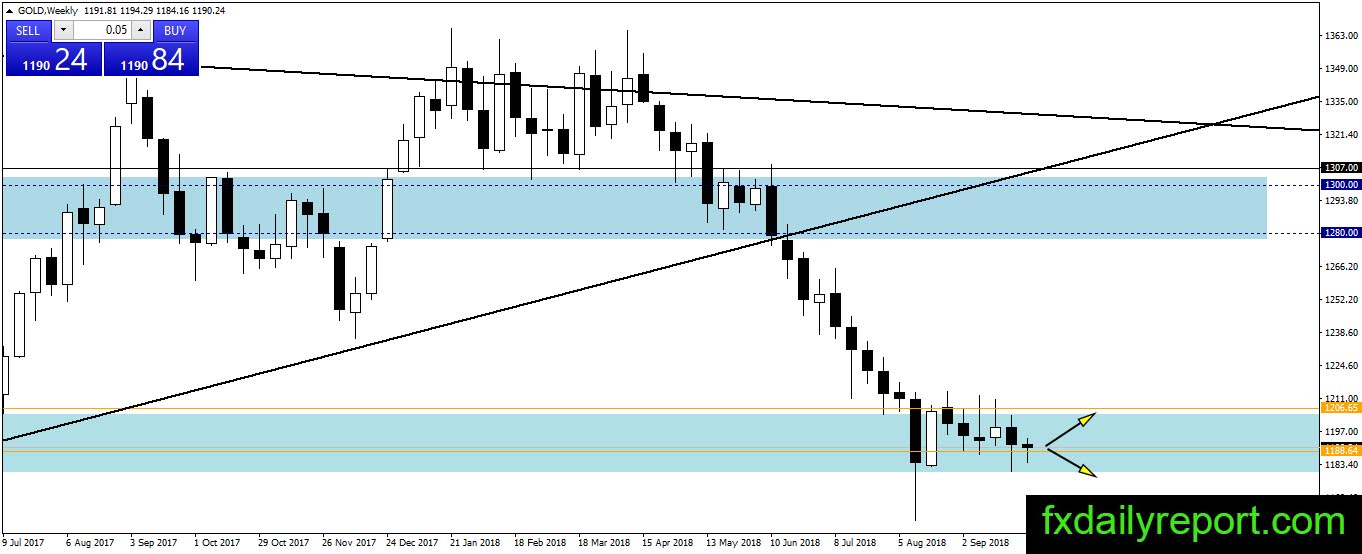
On the weekly chart, gold traded sideways inside the blue box and looks will continue inside it. There is no clue yet on the next direction. However, the overall trend is bearish and suggest it is better to side with the bear rather than the bull.
Daily Chart
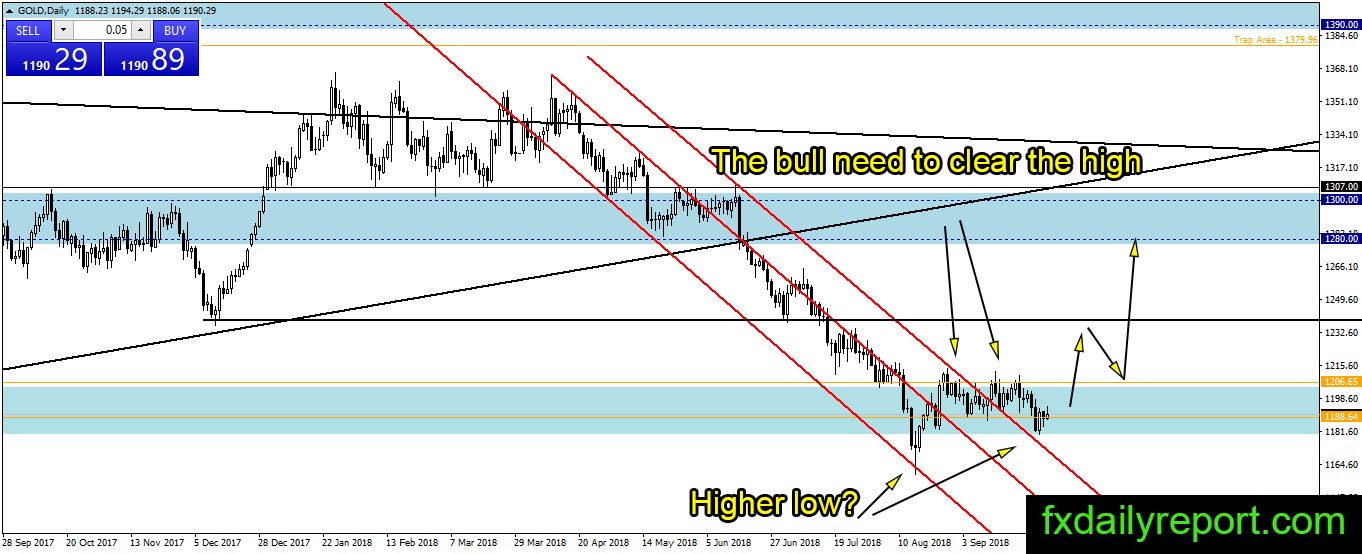
The only chart which shows potential bullish scenario is the daily chart. We could see the price breakout of the bearish red channel and the bull prevent another lower low. If the bull could clear the “high” marked on the chart, then it might start a new bullish trend. Moreover, the bear part to print lower low is harder than the bull task to print higher high.
Trade Plan
Bullish trade – $1,180 – $1,200 is the area to watch for the long position the lowest the better. A tight stop below the area also preferred.
Bearish trade – Short position around $1,250 is the plan to watch. Another short-term trade to watch is short from $1,206 when the price failed to surpass the level and formed a strong bearish pattern. (Same strategy)