
The US Dollar (USD) slid down against the Canadian Dollar (CAD) on Monday, decreasing the price of USDCAD to less than 1.3300 following some key economic releases. The technical bias remains bullish because of the higher high in the recent downside move.
USD/CAD Technical Analysis
As of this writing, the pair is being traded around 1.3216. A support can be noted near 1.3173, the trendline support ahead of 1.3112, the 38.2% Fib level and then 1.3049 the major horizontal support as demonstrated in the given below chart.

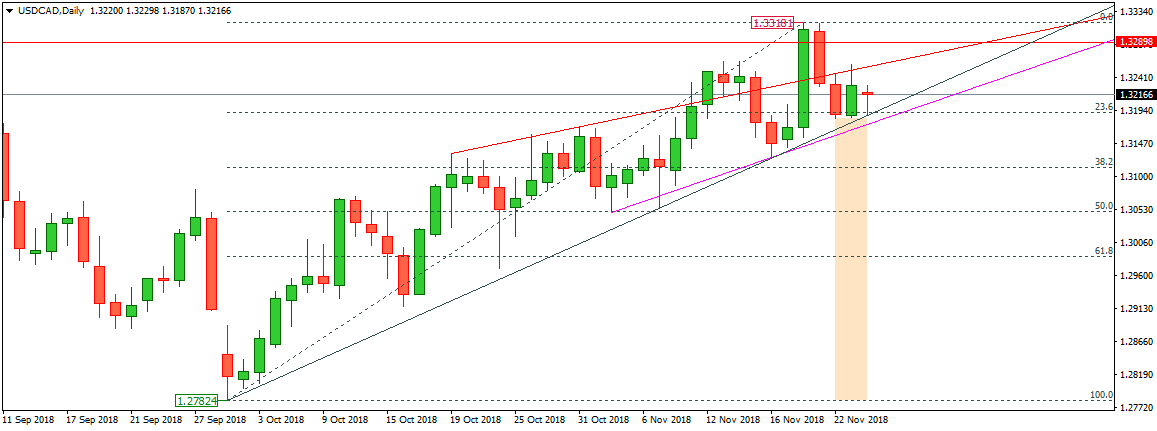
On the upside, A resistance can be noted around 1.3254, the trendline resistance ahead of 1.3289, the horizontal resistance level and then 1.3318, the key horizontal resistance as demonstrated in the given above chart. The technical bias shall remain bullish unless 1.3112, the major horizontal support level remains intact.
USD ISMI Prices Paid News
In the US, the figure concerning the price index of ISMI remained 72.1 in August, as compared to 73.2 during the month before, up beating the economist expectation which was 70.2. The data is copied from the news released by the US Institute for Supply Management.
It shows the prevailing condition of the manufacturing market of the country. The figure is derived after taking into account various elements of the market such as new orders placed, the estimated rate of production for the future, employment rate, available inventories, and deliveries made so far.
The ISM figure is considered as a sensitive indicator of the US economy. It is also taken as an indicator of the sentiment of business concerning the inflation that may occur in a due course of time. Generally speaking, a high reading in this regard is taken as a bullish trend for the US Dollar (USD) and vice versa.
Trade Idea
Considering the overall price behavior of the pair over the last couple of days, buying the USDCAD around current levels can be a good decision in short to medium term.