
Silver long-term technical analysis
Another commodity which is interesting to discuss when market waits for interest rate change is Silver. If Gold fell almost 50% from the top, we can see silver dropped hard from $49 to just $13.6 or 67%. When the economy in risk aversion mode, market players will turn into precious metals and this time uncertainties caused by the Fed might drive people to silver and gold.
Monthly chart
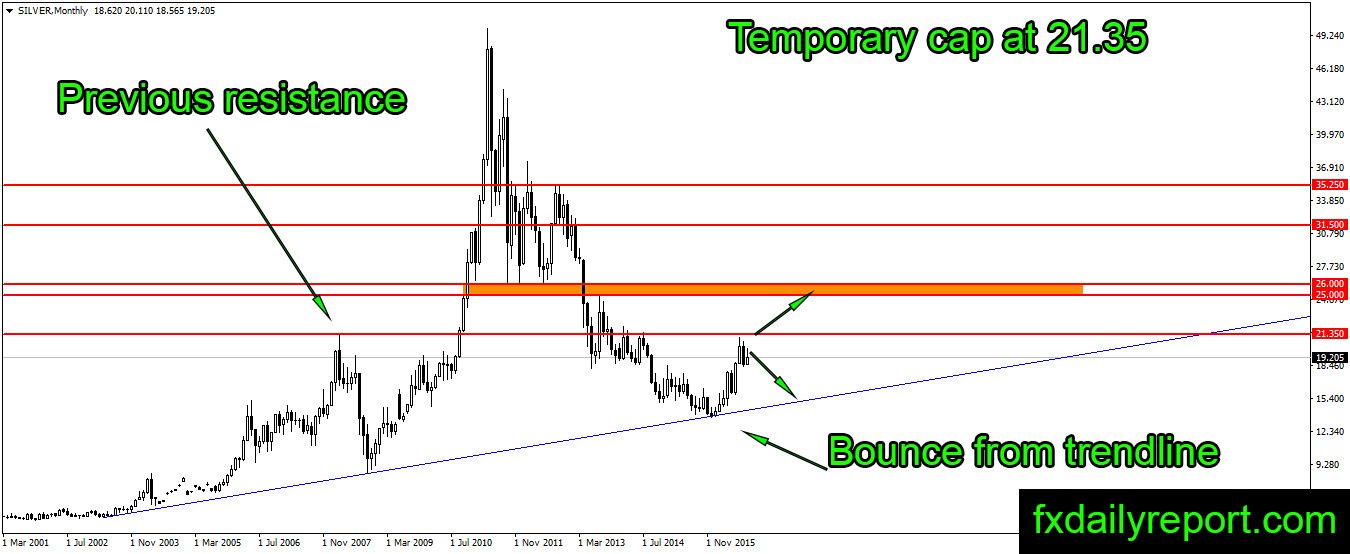

On the monthly chart there are several facts happened:
- Price bounced from blue uptrend line, the bounce valid and currently challenging 21.35
- On the previous bearish trend, price flipped around $25 – $26 area. If price able to get to that area, we will see profit taking.
- When $21.35 visited in the second month, price closed as a bearish candle, but September turns positive, this means profit taking, and more bullish movement expected.
Weekly chart
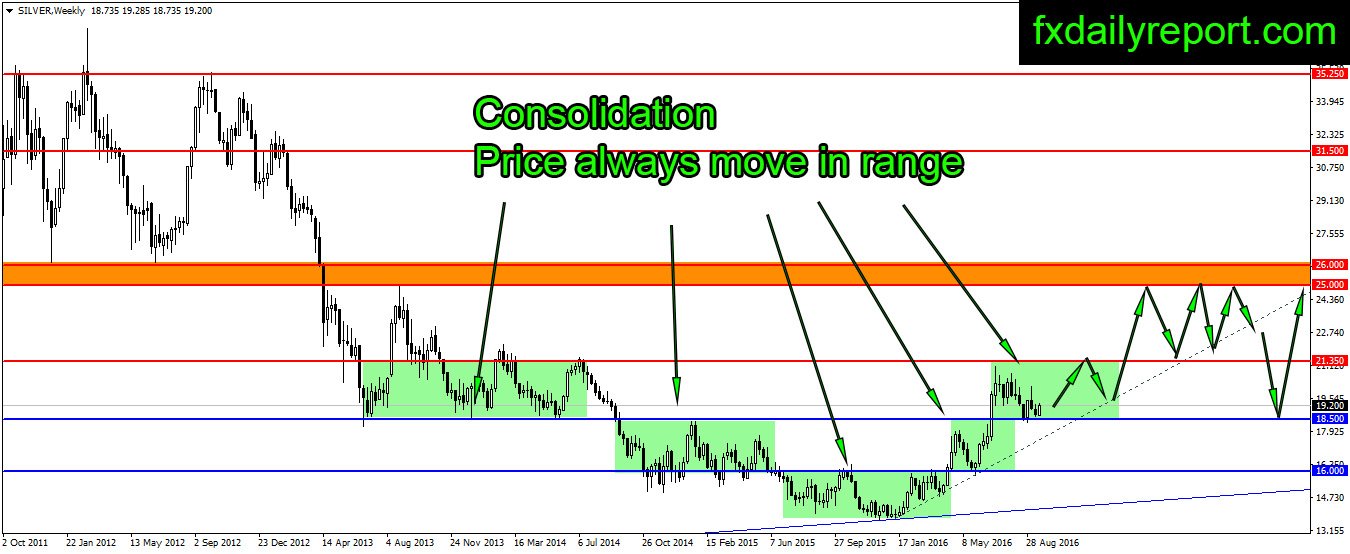
The movement on weekly chart contrasted by range movement, green boxes shows that price makes a range before jumping into next range. Currently, the price range is 18.5 – 21.35, a long position near the 18.5 targeting 21.35 for short term is high odds.
The up trend in Silver also supported by trend line that connected January’16 low and May’16 low.
Daily chart
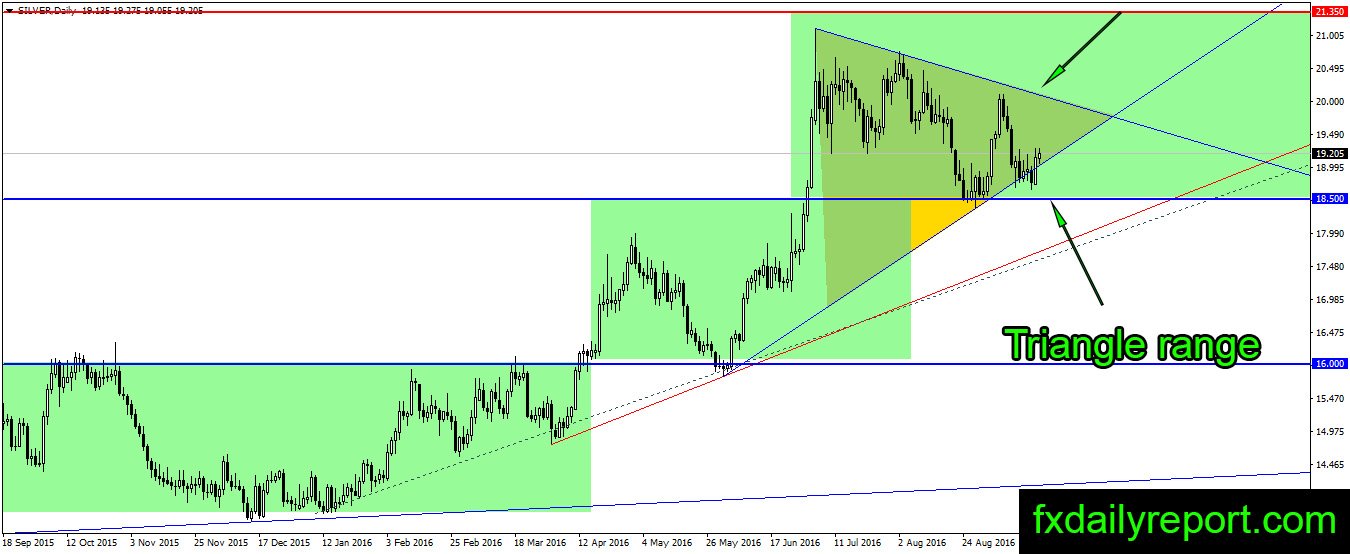
While the weekly chart shows clear movement, daily chart is trapped inside a triangle. Silver might move inside the triangle range for several days / weeks until it reached the end of triangle range.
Trade plan
Best plan to take is trading the range. When price reached the lower part of the range, then take a long position, when it reached upper than then take a short position. The long position should give better winning ratio as the trend shift to bullish until $25 – $26 touched.
Long term short should be avoided until the price reached $25 – $26. Best long position for the current situation is from $18.5.
While the long position has higher odds, it always better to place insurance (Stop order) against a move below $16 as a precaution.