
EUR/USD long-term technical analysis
Dovish fed not followed by ECB, the central bank decides to end loose monetary policy last year. However, the central bank might soon return to loose policy again as economic slowdown return. Current market expectation sees no rate-hike from the Fed at least until the second quarter this year.
If ECB decides to start a new round of stimulus we might see EUR moving higher. Aside from the slowdown issue, Brexit which will happen in March and Italy recession might become a major challenge for Eurozone.

EUR/USD might continue under pressure and will depend on the development of the global market situation, especially trade war situation between U.S-China.
Click here to see EUR/USD long-term analysis December 2018
New Month
Monthly chart
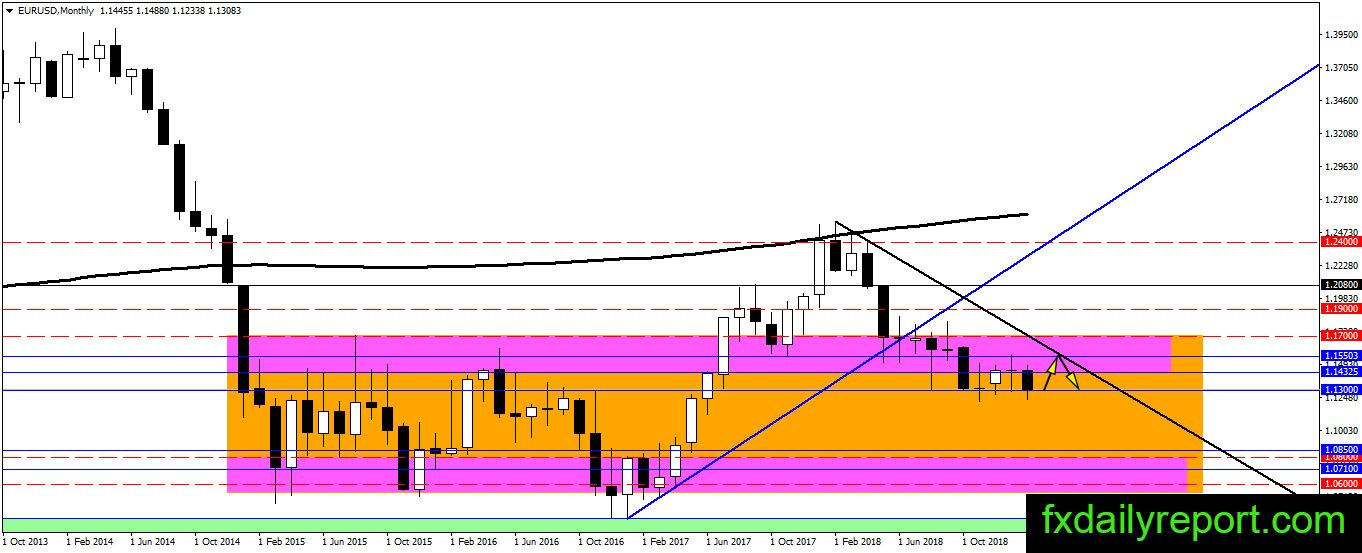
The high gets lower on EUR/USD monthly chart. Fortunately, the low not getting lower each month and the pair always avoided a close below 1.1300. As long as there is no close below 1.1300 then EUR/USD still has a chance to bounce and start a new bullish leg.
Weekly chart
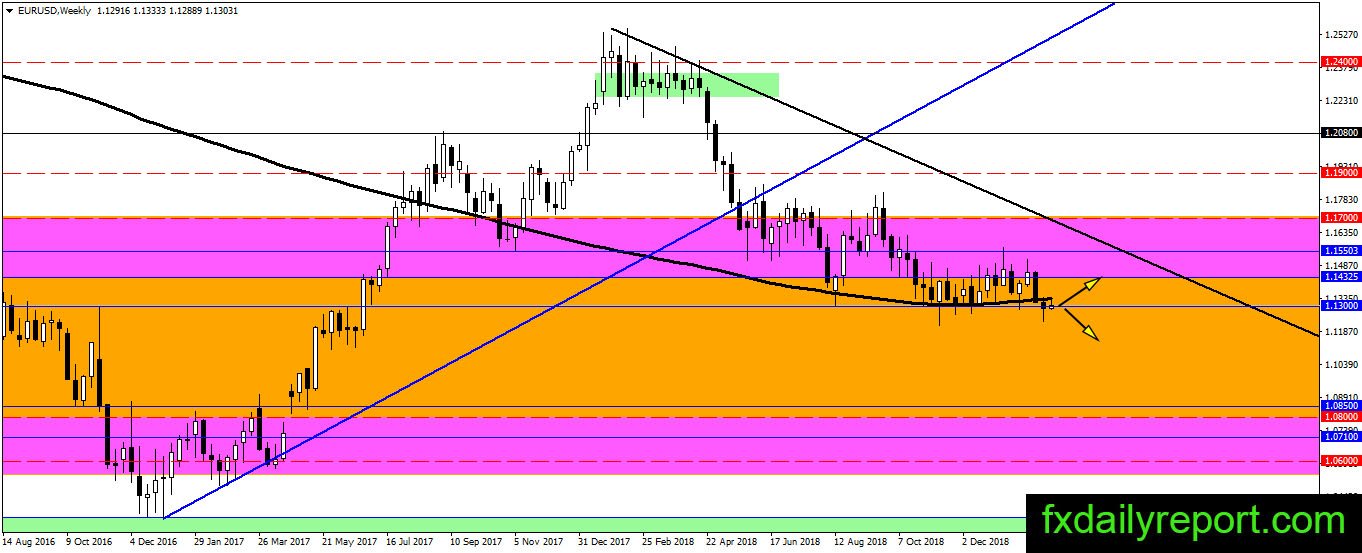
The weekly chart of EUR/USD provides us with a similar outlook as its monthly chart. However, the price closed below WSMA 200 which provide a threat for the bull. If the pair continues to stay below the averages then EUR/USD might resume its bearish movement below 1.1300.
Daily chart
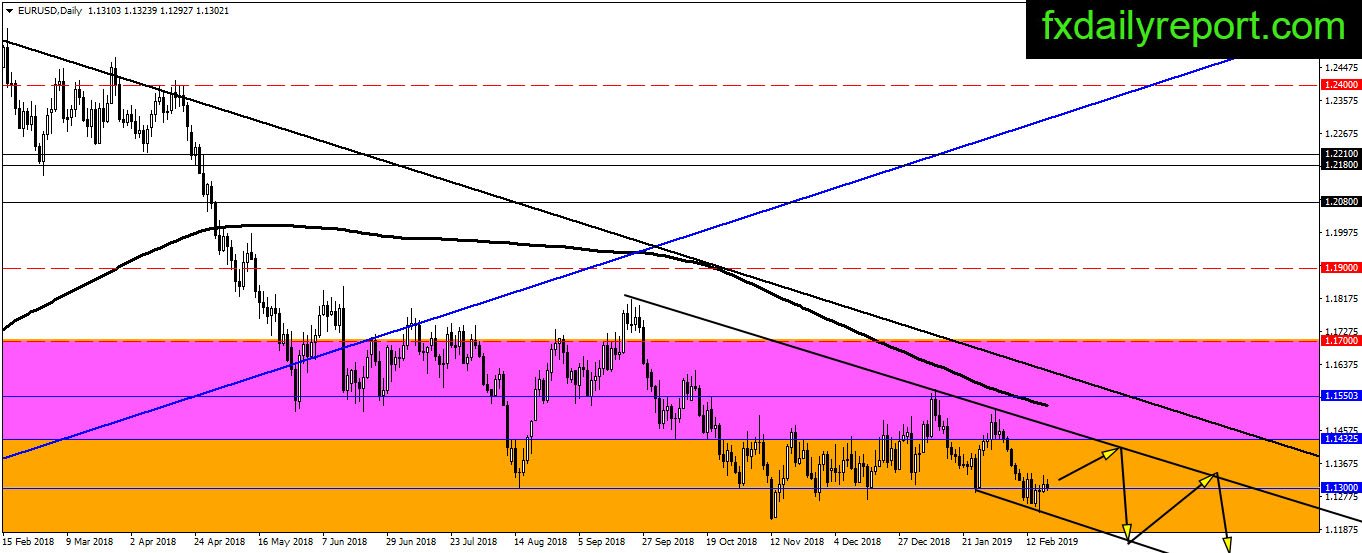
Lower low printed on EUR/USD daily chart and the pair risk further downside. Even though the pair currently moving up above 1.1300, it is possible the bear will enter the market and make sudden selling. On the chart, the pair projected to move inside the bearish channel.
Trade plan
EUR/USD at a crucial moment right now. The pair risk a slip into a further bearish trend and 1.1300 also WSMA is the support level which prevents it. If we have a close below 1.1300 on the monthly chart then it is better to exit long positions.