
USDX (USD Index)
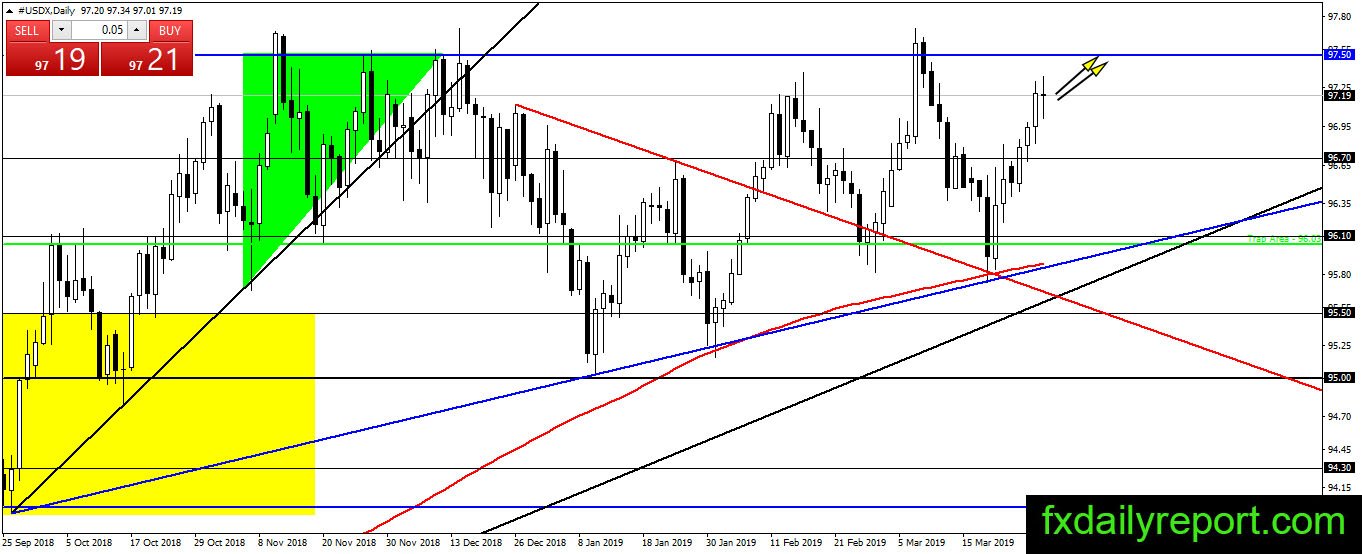
The index upward movement continues in the previous week and it is not far from 97.50 resistance. At the end of the previous week, the index formed a neutral candlestick pattern which suggests possible pause. The index expected to reach 97.50 soon and traders could find next direction clue through reaction at the resistance.
News to watch

08.30 AM U.S Core Retail Sales m/m, forecast increase of 0.4%
Retail Sales m/m, forecast increase of 0.3%
10.00 AM U.S ISM Manufacturing PMI
For full outlook for this week, you can follow Forex Outlook For The Week 1-5 April 2019
Technical Analysis
EUR/USD
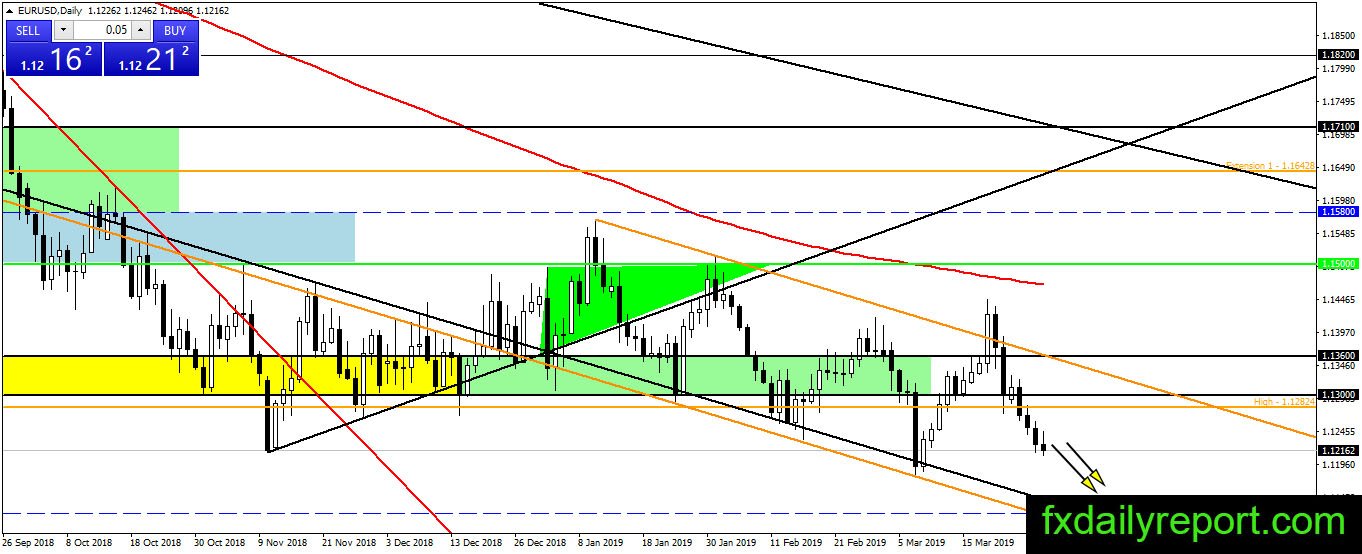
The pair direction is downward and there is no change to the direction yet. It is better to avoid long positions until a strong bullish reversal pattern formed. On the other hand, short positions are better taken near 1.1300 when there is a bearish reaction from the level. At the current time, traders could take a “Wait and see” approach.
today critical levels to watch:
Support: 1.1200
Resistance: 1.1300, 1.1360, 1.1400
GBP/USD
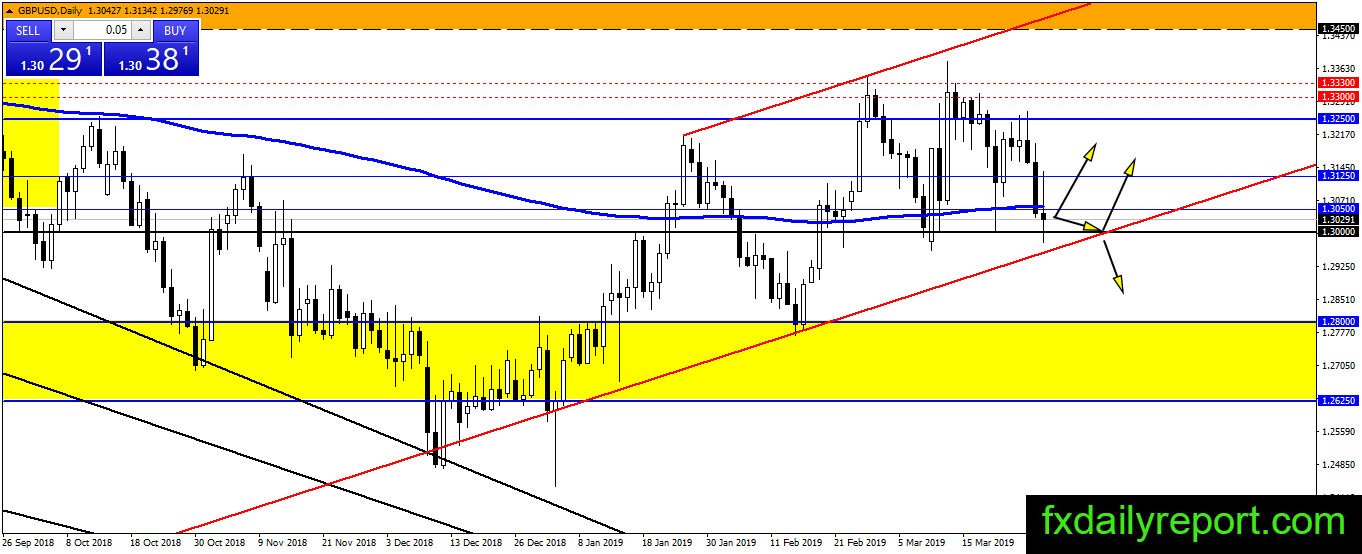
A close below SMA 200 happened but GBP/USD managed to hang above 1.3000. The pair is in a dangerous situation of breakout lower. Brexit development continues to thread the uncertainty path. UK MP rejects Theresa May third Brexit proposal. On the weekend, sources said May will propose a fourth deal to the parliament.
GBP/USD could move sharply when the final result announced. Traders might want to continue stay sideline for now.
Today Critical level to watch:
Support: 1.3000, 1.2800
Resistance: 1.3125, 1.3250, 1.3300, 1.3330
USD/JPY
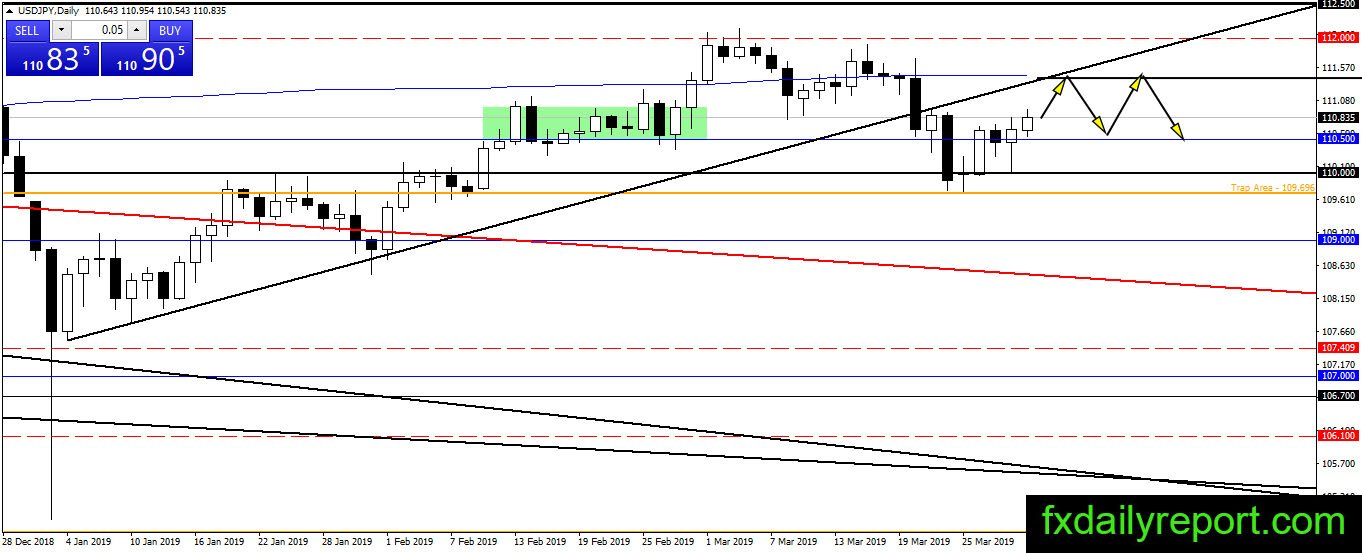
The pair secured a bounce from 110.00 support level and it closed at the opening level of massive two weeks ago Friday bearish candlestick. USD/JPY expected to continue its bullish movement to test SMA 200 or the trendline. Traders could use 110.50 as the level to take long positions.
Today critical levels to watch:
Support: 110.50, 110.00
Resistance: 111.00, 112.00
AUD/USD
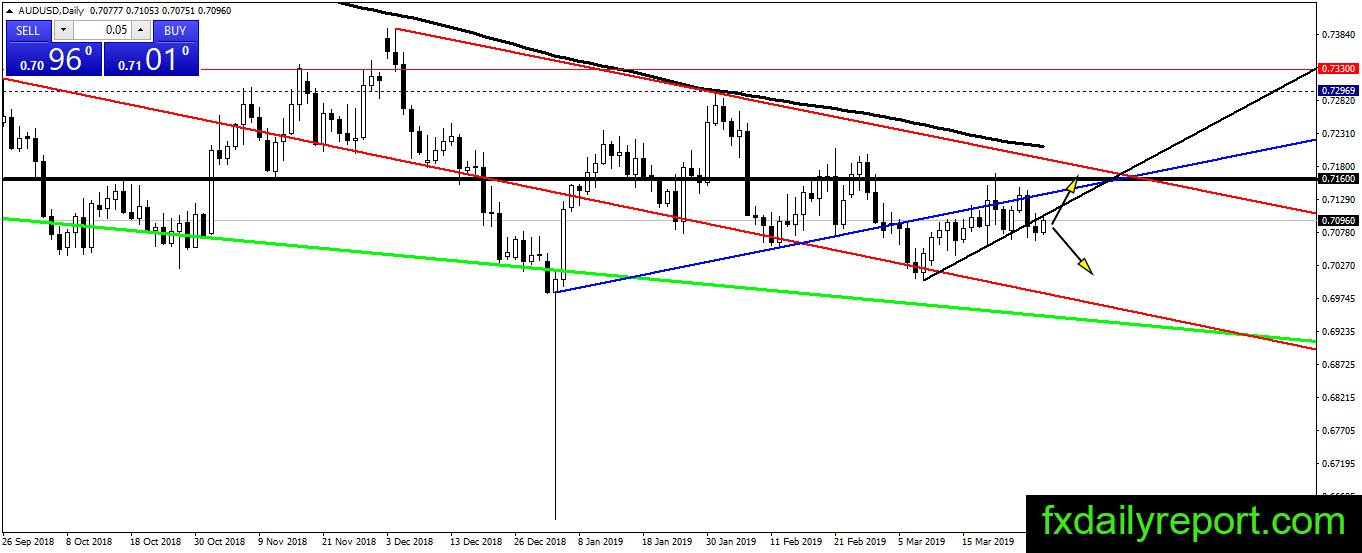
We have a breakout below the trendline on the AUD/USD daily chart. However, there was no strong bearish momentum seen on the chart yet. AUD/USD closed near the trendline and attempting to cancel the breakout. Will it manage to climb further upside this week or start to descend and continue the bearish trend?
Today critical levels to watch:
Support: 0.7080, 0.7000
Resistance: 0.7160, 0.7200